Instead of looking at financial markets or asset classes on an individual basis, intermarket analysis looks at several strongly correlated markets or asset classes, such as stocks, bonds and commodities. This type of analysis expands on simply looking at each individual market or asset in isolation by also looking at other markets or assets that have a strong relationship to the market or asset being considered.
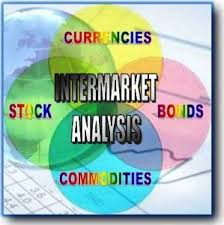
Typically, there is an inverse correlation between stock and bond. When the economy is acting poorly, central bankers tend to lower interest rates to help stimulate growth. As interest rates go down, bond prices go up. On the flip side, when the economy is doing well, company profits are increasing, which leds to inflation, which causes interest rates rise to tame that inflation, which pushes bond prices do down.
NOTE: Rising rates makes it costlier for companies to borrow money because they need to pay a higher interest rate when they issue new bonds. When new bonds are issued, they push down the prices of lower-yielding existing bonds, so the rates of those bonds, match the rates of the new bonds.
In mid-November, Federal Reserve Chairman Jerome Powell told the world that he was putting interests rates on hold. Powell later said that fiscal policy would be needed to support the economy in any downturn. Many took his announcement as a reason to kick start the equity markets again.
If the global downturn has bottomed and economic growth rebounds in the coming year, what is the best way to invest?
A new analysis from Ned Davis Research comes up with some familiar responses to that question, with a twist.
The firm’s ETF strategist, Will Geisdorf, uses a measurement called the “stock-bond ratio:” the S&P 500 divided by the U.S. Long-Term Treasury Bond Index, to confirm the coming recovery, and to offer some selections. As the ratio rises, stocks do better than bonds, and vice versa.
“The stock/bond ratio has bottomed prior to the economy in each of the last seven global slowdowns,” Geisdorf wrote in a recent analysis. “Barring an escalation in the trade war, we should see a recovery in early 2020 based on historical lead times.”
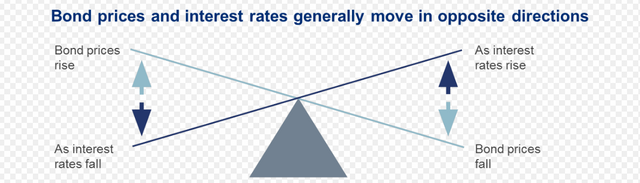
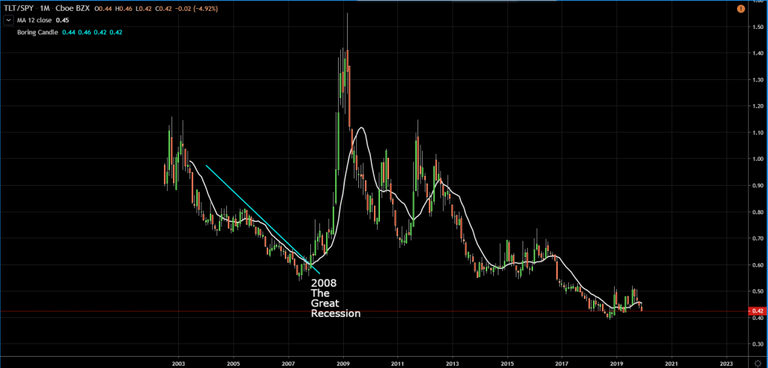
So here is what the TLT/SPY which is representing bond vs stocks look like.
Here what TLT/SPY did during the Great Recession.
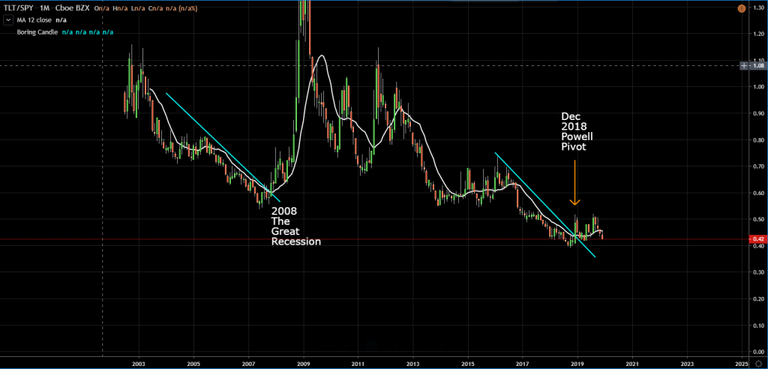
Here what TLT/SPY did during the Fed Powell Pivot.
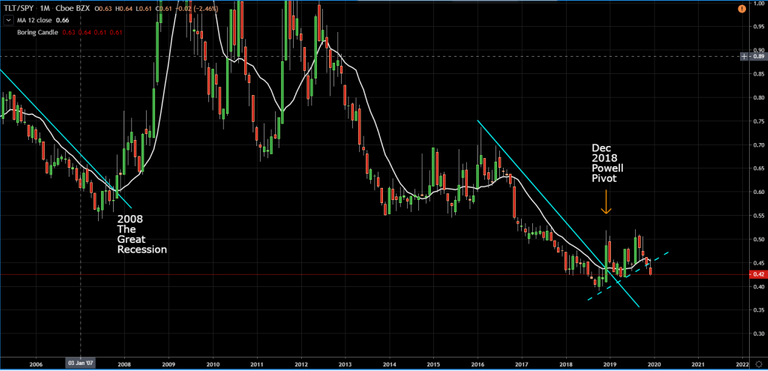
Thus, the TLT/SPY chart suggests to stay long equities until the monthly candles closes above the dotted up trendline.
This post is my personal opinion. I’m not a financial advisor, this isn't financial advise. Do your own research before making investment decisions.