UPDATE
I was writing this post yesterday as the new daily candle was forming. Then I had some trouble with the thumbnail where I was posting it so I wasn't able to post it right away. That stopped me from posting where I usually post (Narrative, Publish0x, Steem, Trybe, Minds) so I woke up this morning seeing the price action already doing something interesting. You can anyways see the screenshots I'm using to analyze the charts are from the very beginning of the trading day. I'm surprised to see it above $9,300. It's looking like we want to retest $9,700. The bulls are taking over and if they keep us above the cloud then we will definitely retest that area, but as soon as the price becomes stagnant in the cloud, then we might still be ranging until it decides to break the cloud in either direction, although for many reasons I list below in this post, you'll see that $8,900 is a strong support for this move. So I hope you gain valuable insights into the latest bitcoin price action with my post. Thank you for reading.
Hello everybody, I'm going to talk a little bit about my technical analysis for bitcoin. A new daily candle started for October 31st as I'm writing this post. (12:00 am UTC). We have all been aware of the extreme volatility of the last couple of days and I would like to first give a revisit of what has happened.
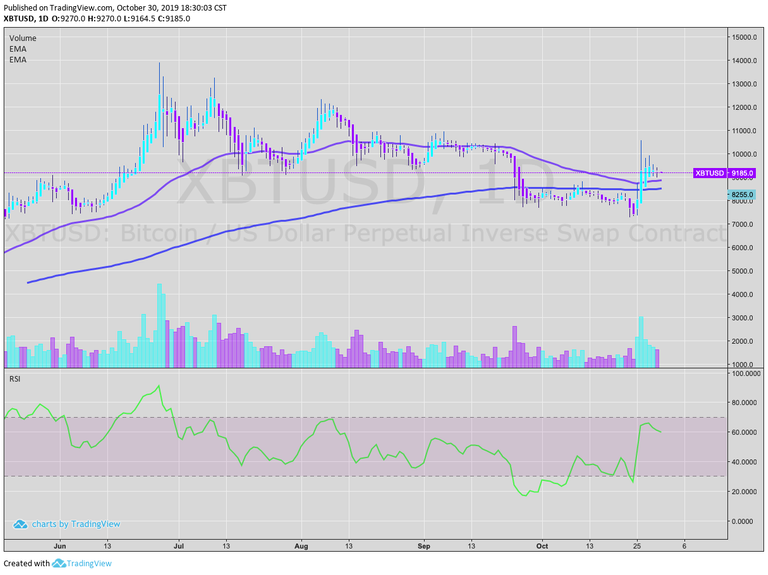
The price action from October 26th was driven by emotions, people were euphoric, and people were losing money shorting. "Liquidation hunts" happened for both bulls and bears. Psychologically, people were scared of the $8,000 floor breaking apart and people were expecting that. What no one expected was a 40% move totally invalidating the bearish short term trend and possibly putting an end to the correction we've experienced since June 26th when price reached $13,900. Now we are sitting above both 50 and 100 EMA which now also invalidates the death cross everyone was scared of as well. Overall the trend seems to be resuming to give the upwards movement another leg up. The RSI levels are back to being bullish, and so we're still in a long term uptrend.
Now, if we take a closer look, we might notice we are in an obvious correction after hitting $10,500. We overlap some fib levels plotted from the lowest low of $3,100 to the highest high of $13,900 and we see that when price dropped to $7,400 it was almost hitting the 61.8% retracement. definitely a buying area. We pierced the significantly strong resistance at $8,500 and wicked above the $9700 another fib level (0.382). This is why now $8,500 is our significantly strong support. You can see how the 50% fib level aligns almost perfectly with the 200 EMA in the daily chart above. As you notice, I also like to analyze chart patterns using almost solely heikin ashi candles. They have a much smoother representation of momentum and trending action so unstable areas are much more visible with heikin ashi wicks. Traditional candles are great to keep as reference of what the market is watching. Usually heikin ashi candles are recommended to be used completely the opposite, them being the reference and basic candles used mainly. This is just my preference, you should test it out and see if its suitable for you.
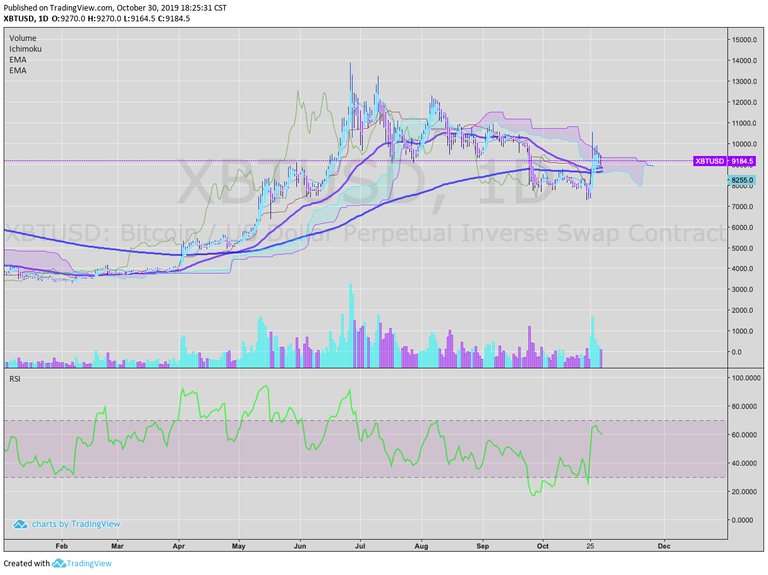
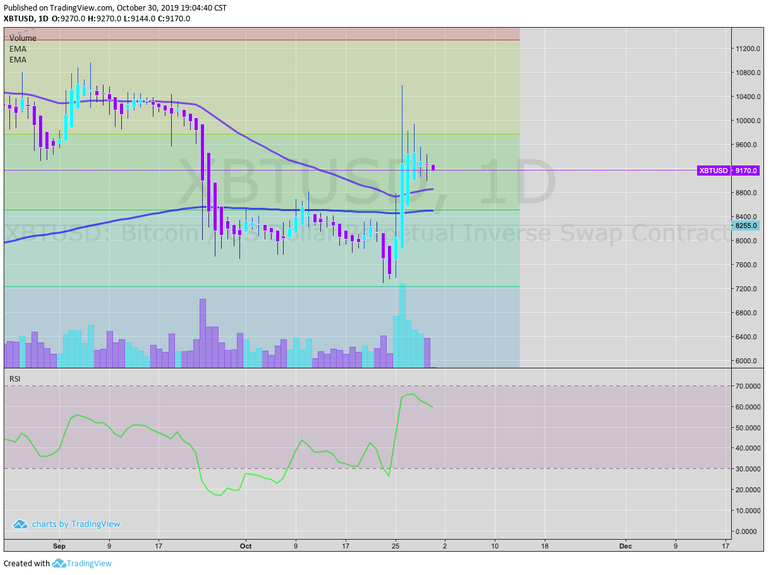
But wait, we can't rush already calling $13,900 again. We still have to deal with the ichimoku cloud first and as you can see, the cloud is acting as resistance and the cloud always represent turbulence or a critical area and that's where we are sitting. As long as we don't start trading above $9,300, then it's more likely to visit lower prices. But watch $8,900. That's a key support before considering $8,500. The clouds from various time frames strongly suggest the idea of $8,900 being relevant. The kijun sen is at $8,946 and the 50 EMA is very close to this level. Notice also how the point where the cloud is turning direction, is at around $8,950, Last time the cloud turned direction was at $10,750, an area that acted in the opposite way as resistance.
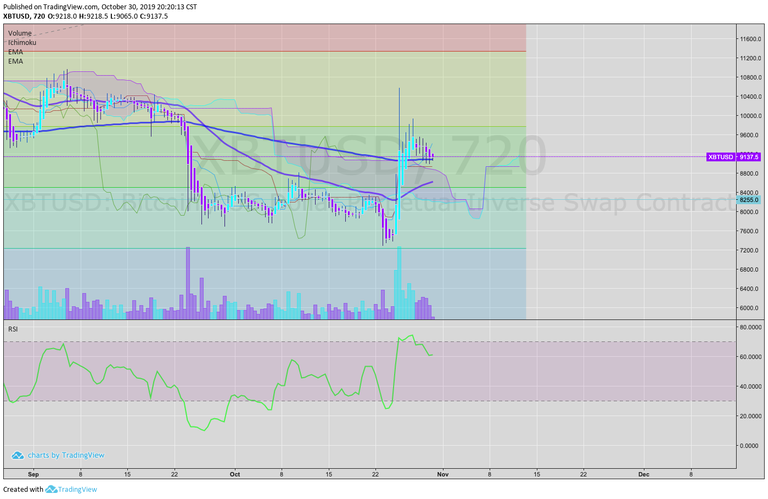
Trading above the 200 EMA in the 12 hour TF is also a positive sign the market is decided to revisit $9,700. Once again, you can see how the cloud opens up at around $8,900, marking that level as support.
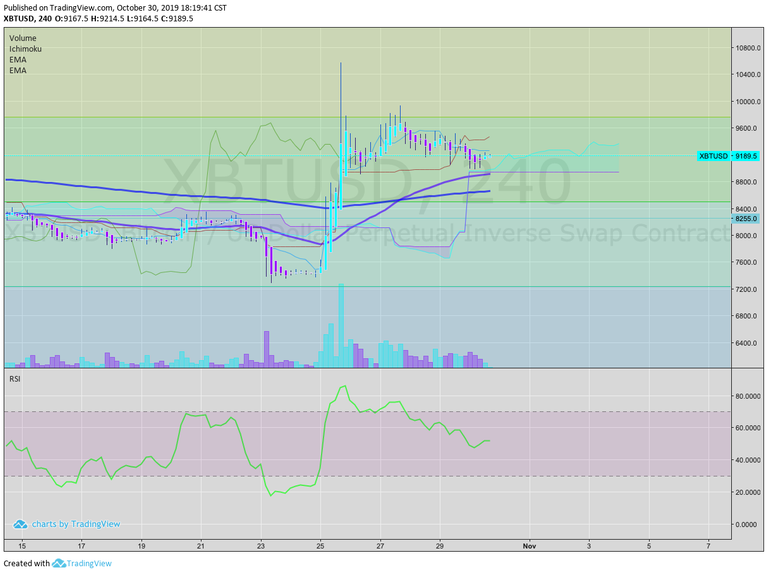
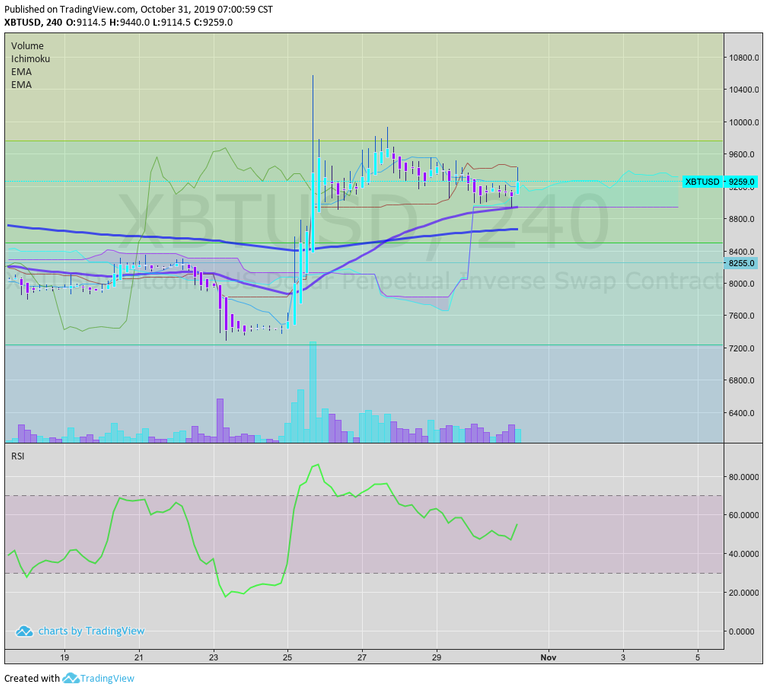
And just to validate other time frames, the 4 hour chart also has a "fixed" support at around $8,900 and a trending support in a range of $9,100 to $9,300. I call it a fixed support because you can see how flat that area of the cloud is, and also how is aligning very much with the 50 EMA. The RSI looks like it rested enough after this move and is ready to keep going up, if this holds true, then the cloud will hold as support and price will be able to stay above $9,300 in the short term. If you're trying to open a position it might be wise to consider $8,900 but don't expect a perfect entry, if the market decides to move, I hope this post gave you a little bit more clues as to where price might follow in the upcoming days.
Congratulations @jungleonion! You have completed the following achievement on the Steem blockchain and have been rewarded with new badge(s) :
You can view your badges on your Steem Board and compare to others on the Steem Ranking
If you no longer want to receive notifications, reply to this comment with the word
STOPDo not miss the last post from @steemitboard:
Vote for @Steemitboard as a witness to get one more award and increased upvotes!