Daily market update #London #session Jan 12th
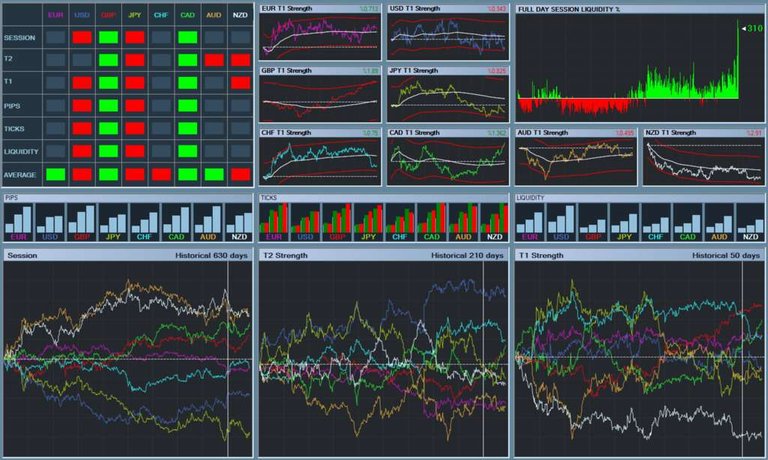
610 day Chart: Long term direction
210 Day chart: Directional Momentum
50 Day Chart: Intraday sentiment
Trade plan based from 630 days
Use the 210 day chart to understand momentum
50 day chart shows how sentiment turns into momentum
White line and to the right are used to recognize the 63 day, 21 day, 5 day trends
Sort: Trending