Welcome to the daily financial report about the Hive blockchain.
All the information presented in this report is based on the data collected from the blockchain until 2021-08-25 midnight UTC. This report aims to provide you with a clear view of what is happening on the Hive blockchain.
1. Price
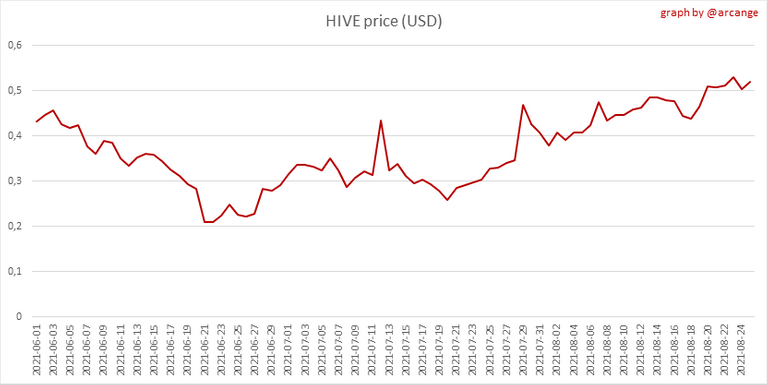 | 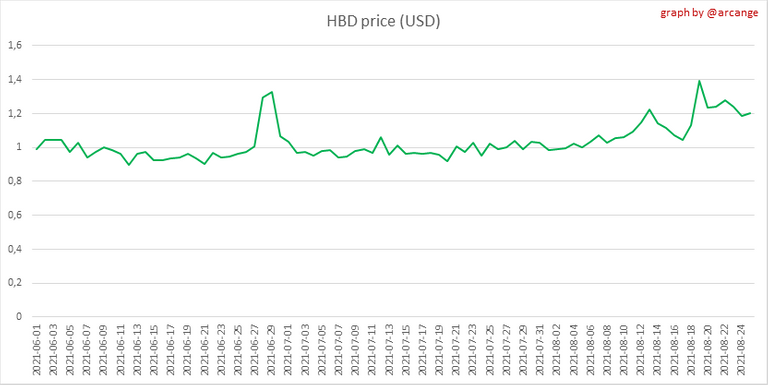 |
These graphs show the evolution of prices in USD for HIVE and HBD.
2. Supply
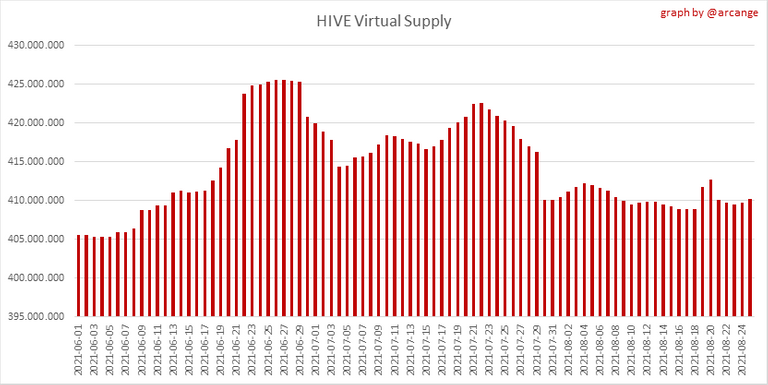
This graph shows the evolution of HIVE Virtual Supply. The virtual supply is the sum of HIVE supply (liquid Or staked HIVE) and the HBD supply (converted into HIVE).
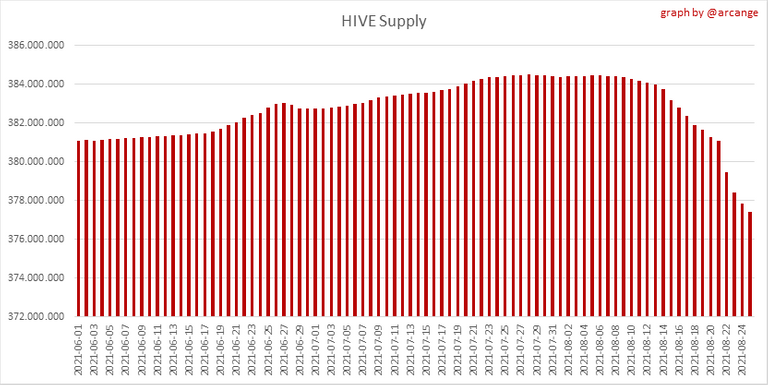 | 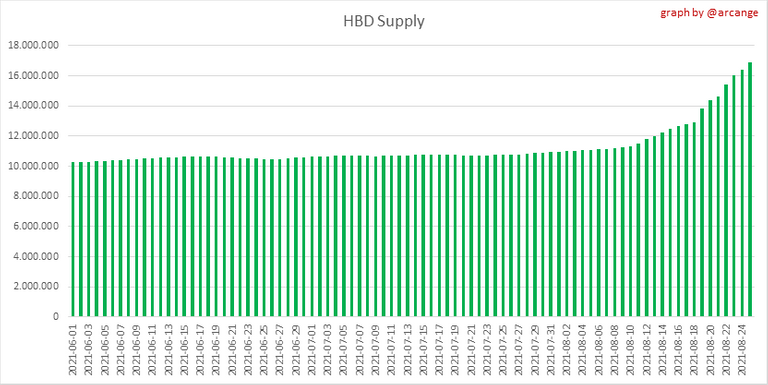 |
These graphs show the evolution of the HIVE Supply (both liquid and staked) and the HBD supply.
 | 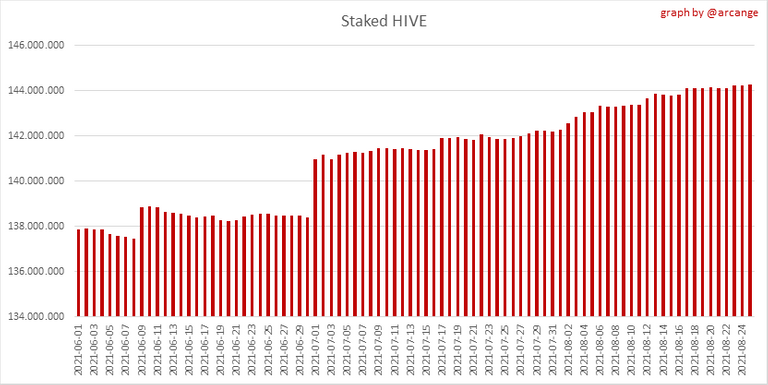 |
These charts show the evolution of the liquid HIVE and the staked HIVE (Hive Power).
3. HBD Savings
Note: As of 2021-06-30 (HF25) interest Is only paid for HBD which are stored in savings.
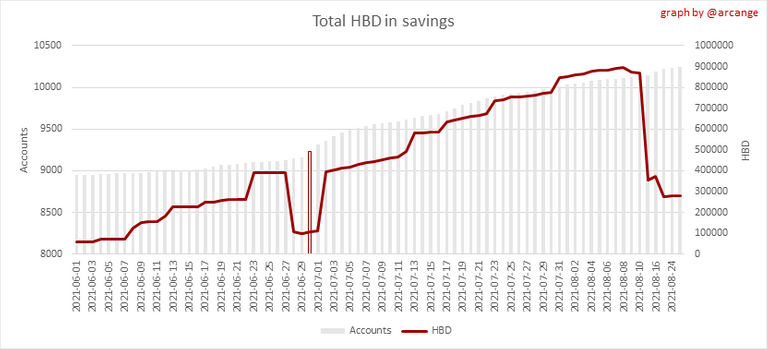
This graph shows how much and how many accounts store HBD in savings.
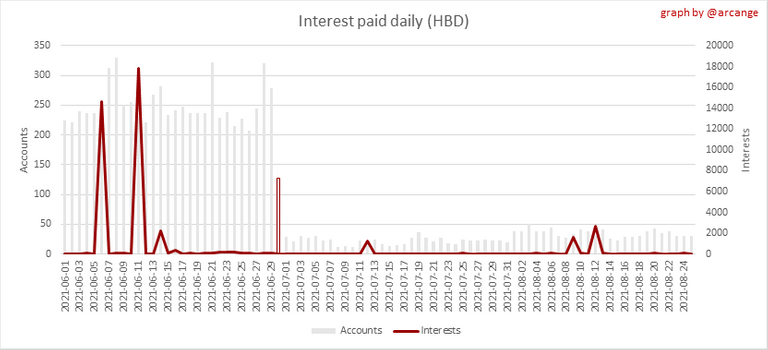
This chart shows the amount of interest paid each day for holding HBD and how many accounts received such interest.
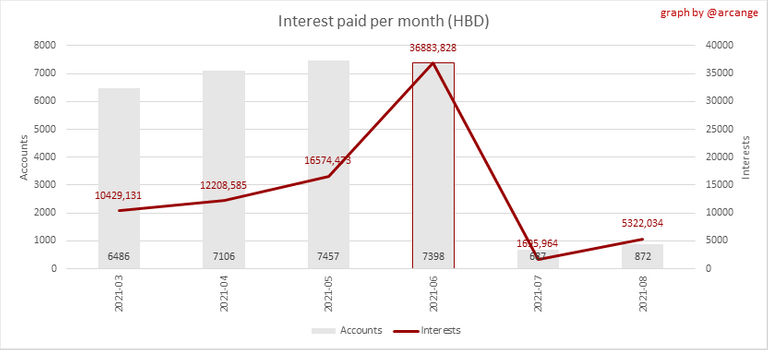
This chart is the same as the previous one, but data are grouped by month.
4. Balances
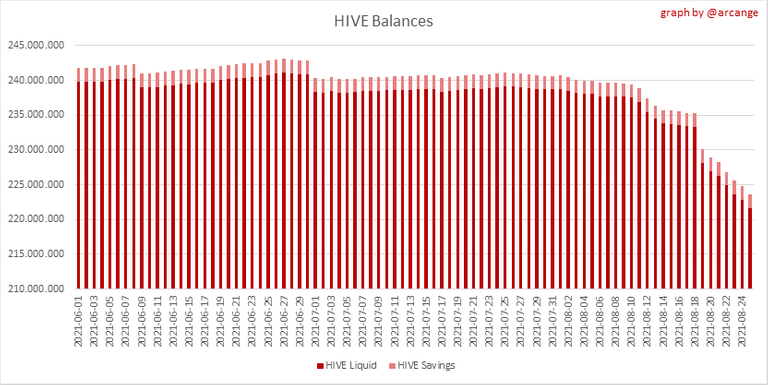
This graph shows the number of HIVE, both liquid and In savings, held by all accounts.
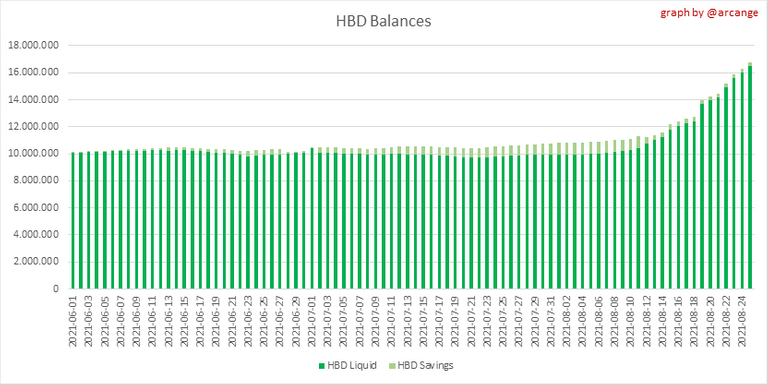
This graph shows the number of HBD, both liquid and In savings, held by all accounts
5. Conversions
Note: As a reminder, conversion requests are only finalized after 3 days. It is only then that it is known exactly how many HIVE were burned in return for the HBD received at the time of the conversion request.
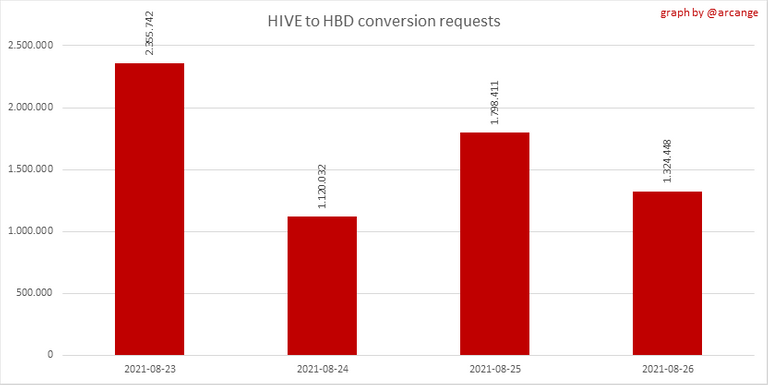
This graph shows the number of HIVE collateralized following requests to convert HIVE to HBD over the past few days.
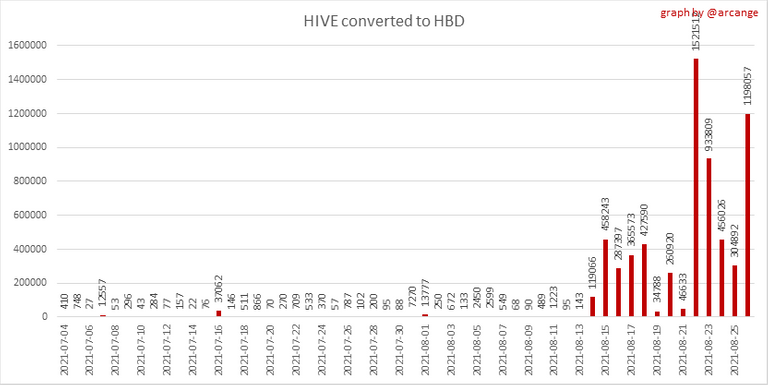
This graph shows the number of HIVE effectively burned per day when requests to convert HIVE to HBD have been finalized.
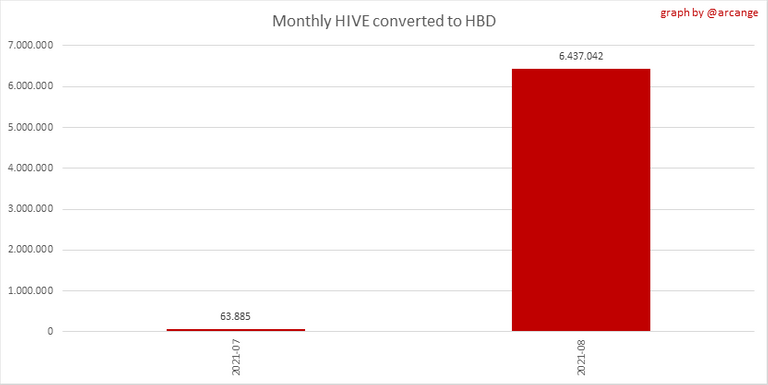
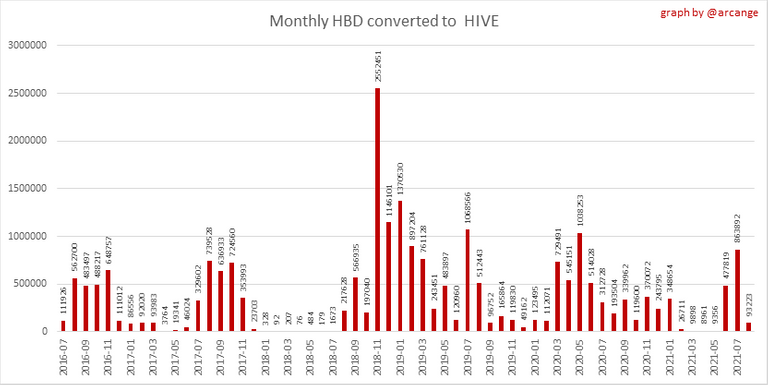
This graph shows the number of HIVE effectively burned each month when requests to convert HIVE to HBD have been finalized.
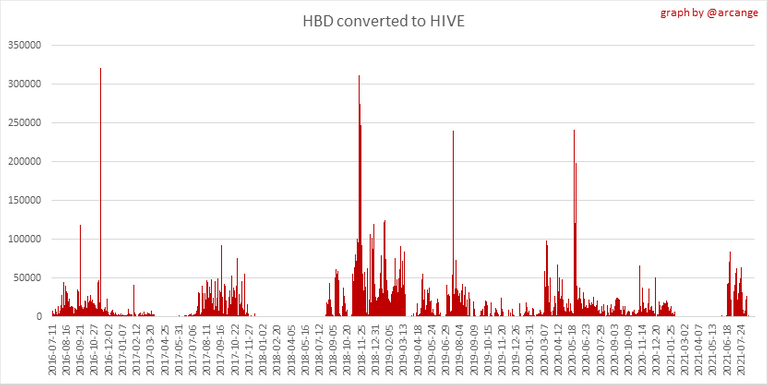 |  |
These graphs show the number of HBD burned each day and each month due to requests to convert HBD to HIVE.
6. Power Up and Down
| Date | Account | Amount |
|---|---|---|
| 2021-08-25 02:55:03 | @animal-shelter | 4,924.224 HIVE |
| 2021-08-25 06:05:09 | @dojeda | 4,226.693 HIVE |
| 2021-08-25 06:41:18 | @sarau | 4,039.214 HIVE |
| 2021-08-25 03:54:57 | @barbibsq27 | 4,020.265 HIVE |
| 2021-08-25 06:44:33 | @leone.bianco | 3,840.801 HIVE |
| 2021-08-25 09:12:21 | @freecrypto | 3,410.899 HIVE |
| 2021-08-25 06:30:24 | @schubes | 3,093.201 HIVE |
| 2021-08-25 07:55:06 | @syndromet | 2,968.139 HIVE |
| 2021-08-25 04:14:42 | @engrsayful | 2,429.832 HIVE |
| 2021-08-25 09:25:45 | @joheredia21 | 2,429.683 HIVE |
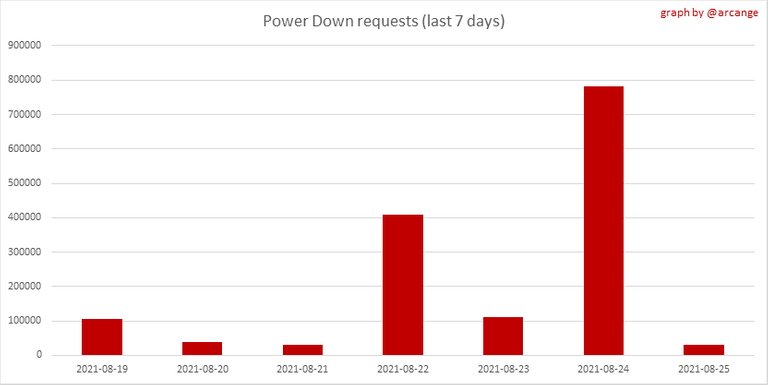
The above graph and table show the amount of power down initiated over the last 7 days, and who initiated the largest yesterday.
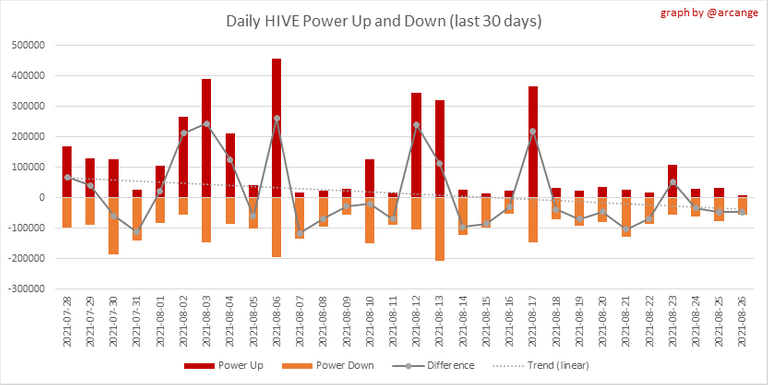
This graph shows the daily HIVE power-up, power-down, and the resulting variation over the last 30 days.
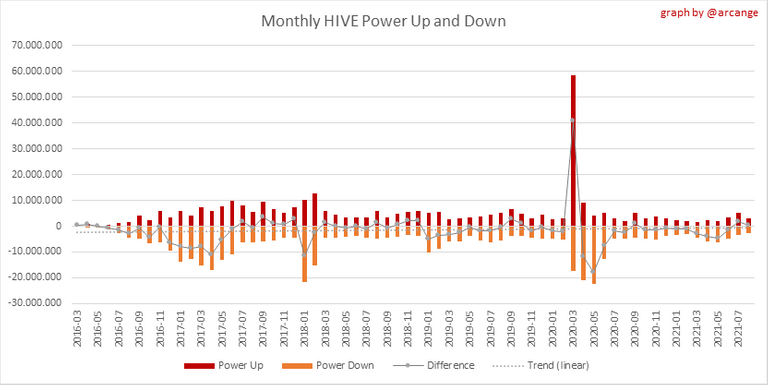
This graph shows the monthly HIVE power-up, power-down, and the resulting variation.
Topmost power-ups and -downs of the day
| Account | Power-up | Account | Power-down |
|---|---|---|---|
| @birdwatcher | 10,446.465 HIVE | @ocdb | 15,200.099 HIVE |
| @notak | 5,400.000 HIVE | @birdwatcher | 11,324.901 HIVE |
| @reward.app | 4,188.104 HIVE | @aggroed | 3,617.712 HIVE |
| @broncnutz | 2,645.685 HIVE | @felixxx | 3,122.142 HIVE |
| @nicole-st | 1,000.000 HIVE | @nathanmars | 3,117.880 HIVE |
| @dcrops | 916.200 HIVE | @jeenger | 2,729.134 HIVE |
| @jphamer1 | 915.000 HIVE | @followbtcnews | 2,700.693 HIVE |
| @fedoraonmyhead | 500.000 HIVE | @jphamer1 | 2,306.115 HIVE |
| @balte | 295.991 HIVE | @pharesim | 2,183.067 HIVE |
| @vastrewin | 274.817 HIVE | @ocd-witness | 2,051.025 HIVE |
7. Transfers
These graphs show the volume (in USD) of HIVE and HBD transferred between accounts.
8. Exchanges
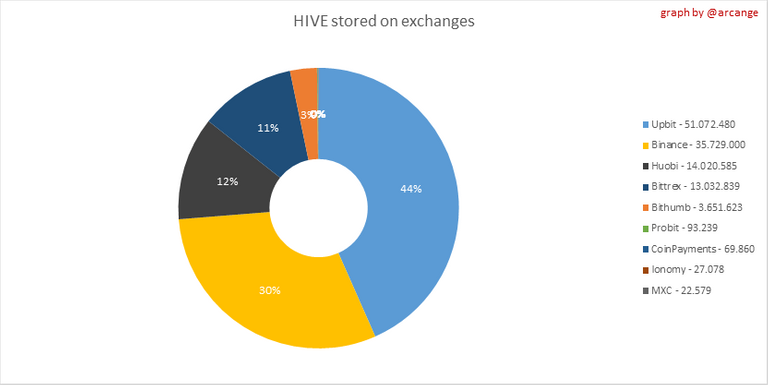
This graph shows the amount and distribution of HIVE stored on the exchanges where HIVE Is listed.
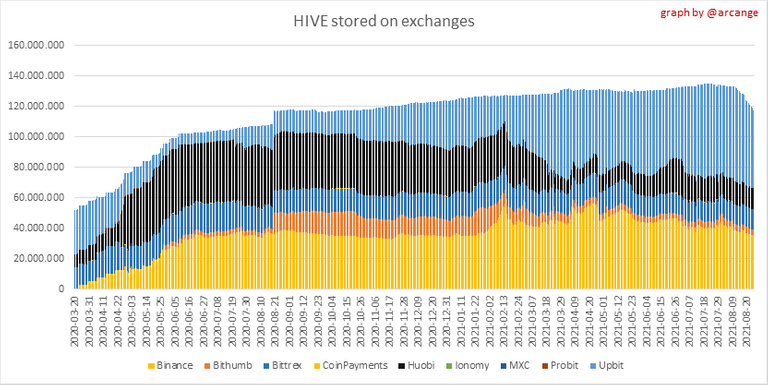
This graph shows the daily evolution of HIVE stored on the exchanges where HIVE Is listed.
I hope you find those stats useful. If you would like to see additional stats, feel free to drop a comment. Your feedback is more than welcome.
Thanks for reading.
Check out my apps and services


Love the new graphs!
Minor nitpick, only 5% of that is "burned", since 95% is added to the virtual supply and may come back when the HBD is converted.
Check today's post. I updated the graph to better see the distinction between converted and burned HIVE.
There is also a third category which is 100K HIVE per day being pulled out of circulation by the stabilizer. Still goes into virtual supply but no 5% burn, 10-20% profit to the DAO (at recent prices), removes supply from circulation (until and unless spent by DAO proposal voting) meaning it doesn't count toward haircut and can't be converted.
I will need to add that 3rd category to my report. Meantime, I updated the graph to display the 5% burned fee.
That's true, but I think this chart is basically just summing 'amount_in' on the vop at the end of a Hive to HBD conversion.
Right, this chart doesn't show that but it's going on in parallel.
I am wondering if the amount of Hive powered down, is less than the new Hive power created by through curation rewards or author rewards, or whether the total Hive power is only growing because of power ups, or not?
This is an interesting question. I may give it a look.
In the charts of the post, only transactions initiated by the users themselves are considered as "power-ups".
I do not take into account the increase in Hive Power generated by curation or publications.
You need to stake more BEER (24 staked BEER allows you to call BEER one time per day)
Love the supply charts!
Might make them biggert hough :)
The rewards earned on this comment will go directly to the person sharing the post on Twitter as long as they are registered with @poshtoken. Sign up at https://hiveposh.com.
$wine
Congratulations, @theguruasia You Successfully Shared 0.400 WINE With @arcange.
You Earned 0.400 WINE As Curation Reward.
You Utilized 4/5 Successful Calls.
Contact Us : WINE Token Discord Channel
WINE Current Market Price : 0.271
I am going to nitpick a bit here. Not all of the "liquid supply" is really liquid. The balance in the DHF cannot be considered as such since it can only be converted to HBD but not transfered or moved in any other way. Maybe a more accurate term would be "non-vested supply" instead of "liquid supply".
The saame criteria can be applied to the HBD supply, only 1% of the balance in the DHF can be moved at any point in time and it does not count for the haircut rule, so I would also include a graph that shows the actual circulating supply.