Welcome to the weekly edition of Steemleo stats. This is no.20 @leo.stats report.
If you want to know a bit more about the Steemleo platform and dig into the numbers, this is the place to be.
This week highlight: The @leo.voter is on the move with record high number of posts and users voted| Spike in the numbers of posts from the leo frontend | Staking continues to show good numbers.

The following topics will be covered:
- Issued LEO Tokens
- Top LEO Earners
- Rewards to SP delegators trough the leo.bounties program
- Daily stats on tokens staking
- Share of tokens staked
- Top Users that staked
- Daily stats on tokens burned
- Number of Steemleo users
- Posts and comments activities on the platform
- Posting from Steemleo.com inteface
- Votes from the @leo.voter account
- Price Chart
Issued LEO Tokens
Let’s take a look into token distribution, inflation and how it is distributed.
Below is a chart that represents the cumulative issued LEO token.
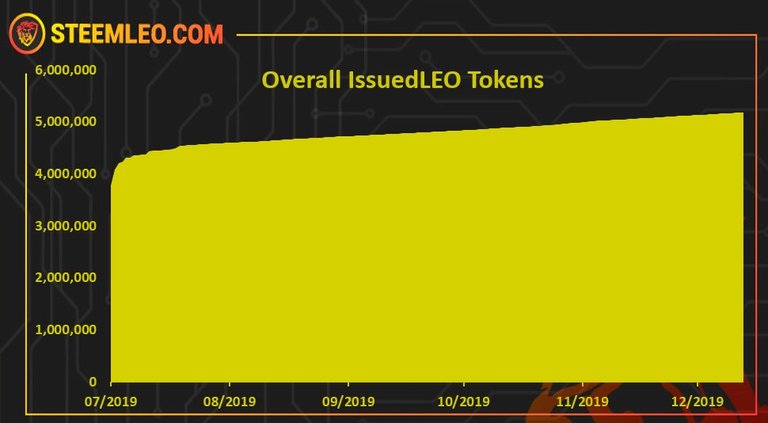
A total of 5.18 M issued LEO tokens.
We can notice that the LEO token doesn’t have a large inflation compared the base supply and its slowly increasing its supply. Note that burnings are not taken into consideration in this chart. That will be presented below.
Next the issued LEO tokens from last week. Here is the chart.
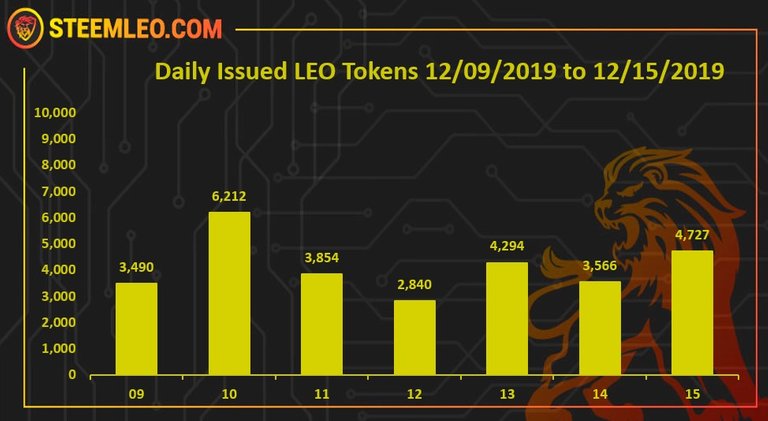
Issued tokens are claimed token that are put in circulation. They are different from the inflation.
In the last week the average issued tokens daily is 4.1k LEO. A total of 29k tokens issued in the week.
Let’s see how these tokens were distributed.
Below is the chart of the top 10 LEO earners in the week.
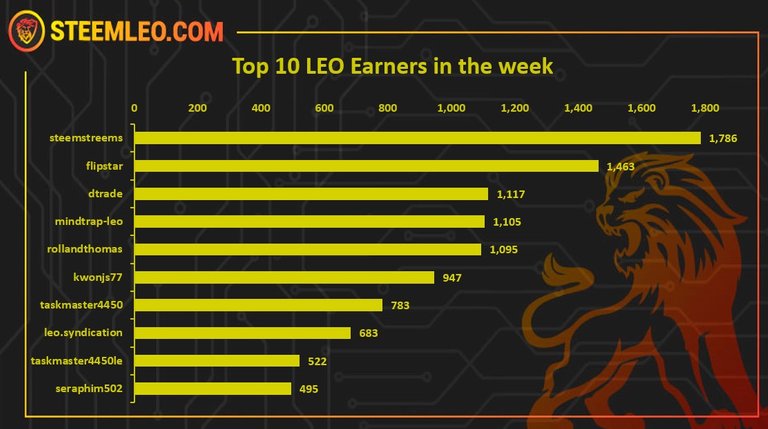
Issued tokens are claimed token that are put in circulation.
On the top is @steemstreems account with 1786 tokens, next is @flipstar and then comes @dtrade.
*Note: The @leo.bounties account is excluded from the list above. Bellow is a separated data on the tokens transferred from @leo.bounties to the delegators.
Reward to SP delegators [Bounties]
The LEO platform has a reward mechanism for SP delegators to the @leo.voter account. Users who delegate their SP to the @leo.voter receive daily LEO tokens. The amount of LEO tokens depends on the LEO price. At the moment with the current price of the LEO, its around 2.2 LEO per day per 1000 SP delegated.
Having more SP to the @leo.voter account provides incentive to users to use the platform and grow the userbase.
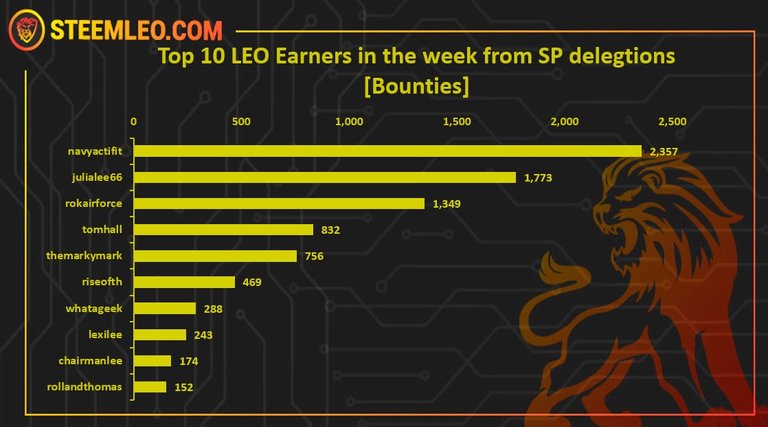
The @navyactifit account is on the top of the list with 2357 LEO tokens rewarded. This account has 155k SP delegated. Next is @julialee66 followed by @rokairforce.
A total of 9973 LEO was rewarded to SP delegators in the last week.
Note that this are not all newly created tokens, but tokens transferred from the @leo.bounties to the delegators. This reward pool is a mix from tokens from leo official accounts, tokens from the market and sometimes new tokens are issued for this purpose. The issued token to the @leo.voter in the week is 3000.
Staking LEO
Below is a chart that represents the daily movement of staking/unstaking of the LEO token.
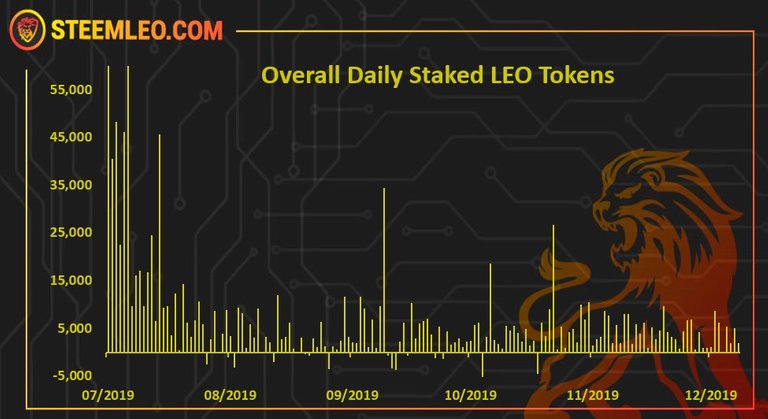
Note
The first five days are excluded from the chart for better visibility. In those days there is a total of 1.6M tokens staked.
The LEO token has a great statistics on tokens staked. This trends still continues.
The chart for the last week looks like this.
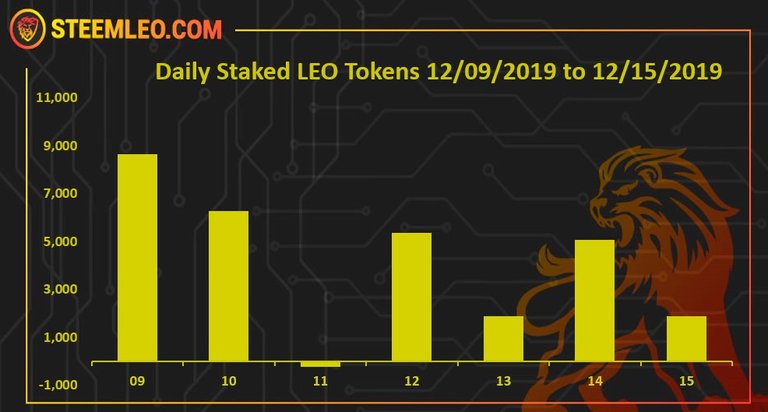
After a long time we have one day in the week with negative net staking. The overall numbers are still great.
Here is the table.
| Weekly Data | LEO |
|---|---|
| Staked | 38,477 |
| Unstaked | 9,447 |
| Diference | 29,000 |
A total of 29,000 more LEO tokens staked last week.
Below is the chart of the top 10 users that staked last week.
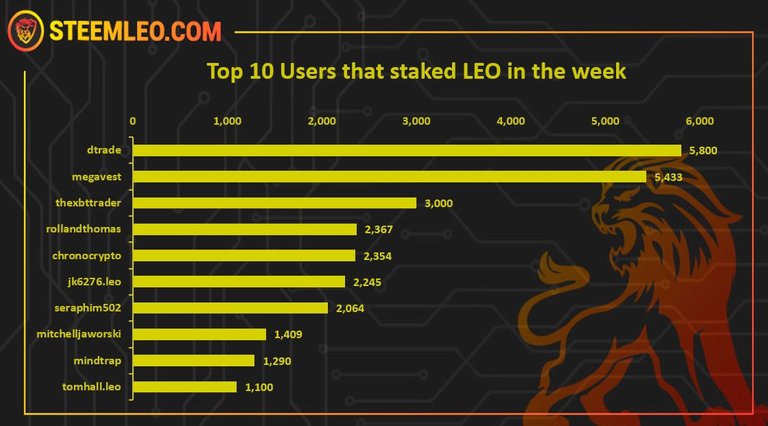
On the top is @dtrade, followed by @megavest and @thexbttrader.
Here is the overall chart on LEO tokens supply.
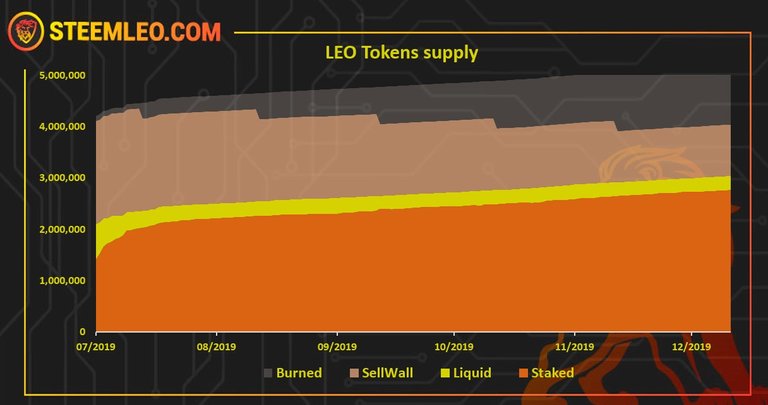
We can see that the staking is increasing over time, the liquid supply is going down. The burnt tokens also are taking a bigger share with the monthly burns from the sell wall, showing the big drops.
Below is a chart of the ratio staked/unstaked tokens, excluding the tokens reserved for burning (sell wall), at the moment with around 1 M tokens.
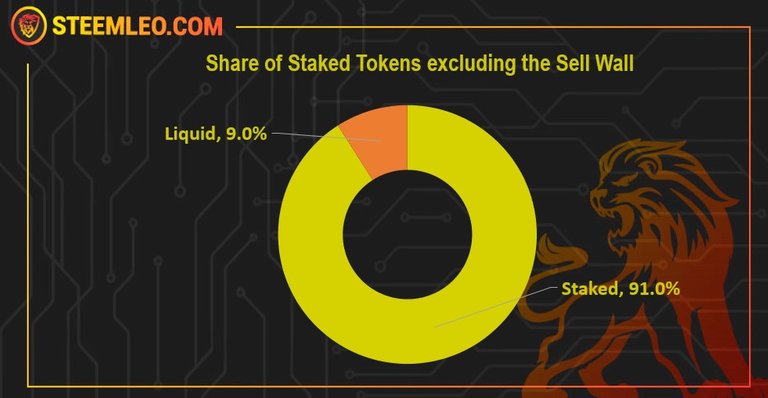
91% tokens staked!
The share of the staked LEO is a long time around the 90%, and it the last weeks is just above that. The liquid LEO tokens are around 274k.
Out of the current supply 4.04 M tokens, 2.74 are staked, 1 M are set to burn and 0,274 M are liquid.
Burning LEO
Burning tokens is an important metric as in a way it is a anti inflationary measure and it shows the use cases for the token or sinks. LEO is having huge regular monthly burn and also all the burns that comes out of its sinks.
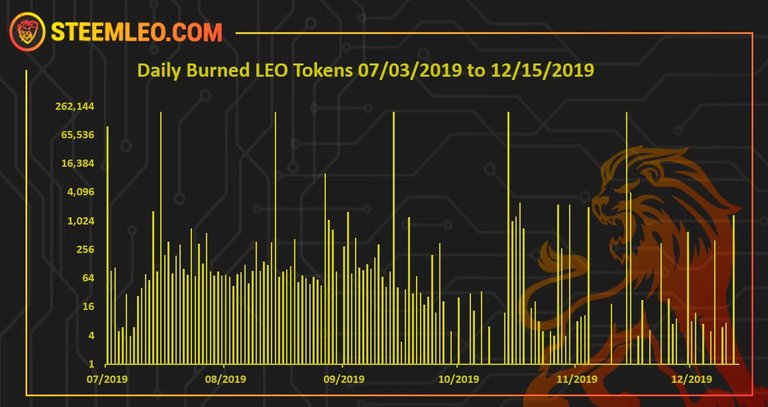
The vertical Y axis is on a logarithmic scale for better readability.
Now there is more than a million LEO burnt, or 1.147 M. The large share of this 1.1 M tokens is due to sell wall burn, and the nopal4you account of 100k tokens.
The rest of 47k tokens are from the sinks for the LEO token.
The LEODEX is bringing more burns lately for the exchange listing fee of 2000 LEO per token. In the last week there was also the burning from steem-engine for ads revenue.
Steemleo Users
Below is a chart with the number of unique users that posted on Steemleo frontend.

A total of 621 unique user have posted from the Steemleo frontend.
Activities on Steemleo
Below is a chart of the Steemleo activities, including posting and commenting from the Steemleo interface and posting and commenting with the Steemleo tag.
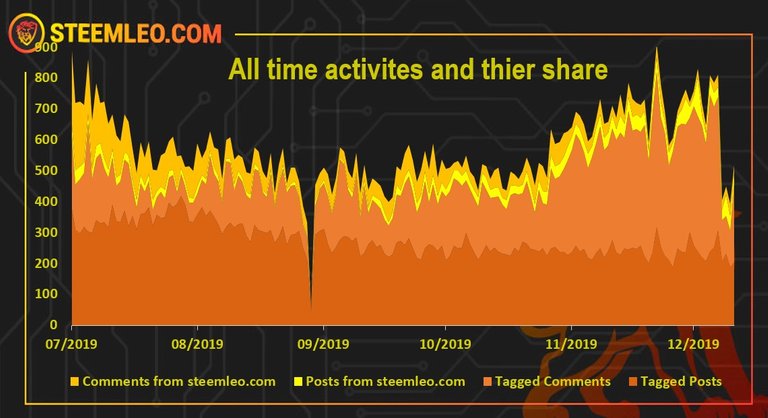
The chart is a bit off with the number of tagged comments showing big drop. Not sure is this some change in the tribes settings or similar.
In the last period Steemleo is trying to incentivize users to post from the Steemleo interface rewarding authors who use the interface with vote from the @leo.voter.
Here is the chart only for posts from steemleo.com interface.
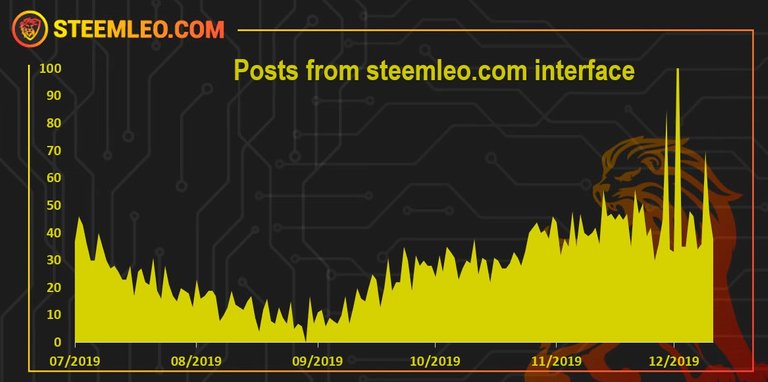
There is an increase in the number of posts coming from the steemleo.com web. This is mainly due to the increase in the SP of the @leo.voter that now holds 680k SP and its rewarding user for posting from the Steemleo frontend.
There are a few spikes in the number of posts from the Steemleo frontend. Maybe even an attempt for abuse?
Using the steemleo frontend is important for the project and the users are encourage to do so.
Weekly Activities
This data is also showing the activities coming only from the Steemleo native interface.
Data for each day of the week was collected and presented on this graph.
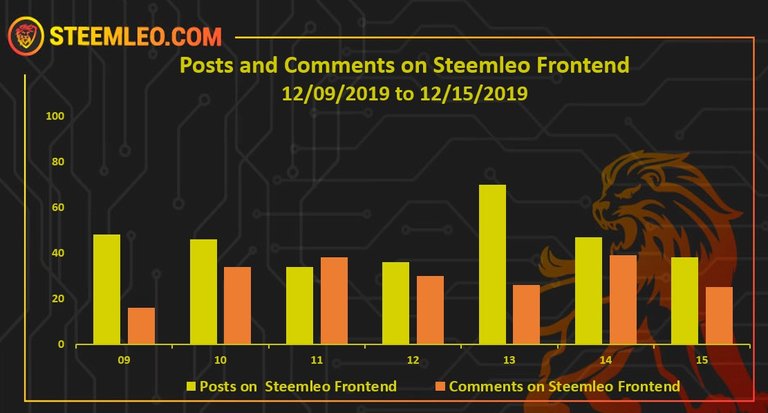
These are all the posts and comments posted from the Steemleo frontend.
The total number of posts on Steemleo in the week is 319 and 208 comments.
Votes from @leo.voter
The @leo.voter account is being converted from a bot to a rewarding accounts to users who use the Steemleo.com interface. Here is the chart.
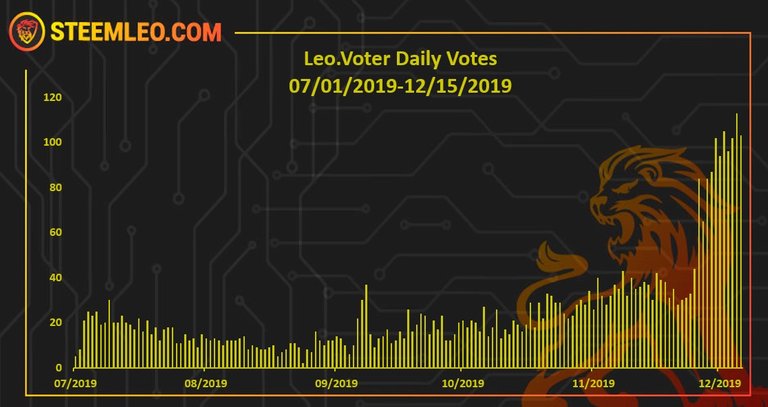
We can see that there is increase in the voting since now it’s being used to reward users who use the Steemleo interface.
A total of 3995 posts voted from the @leo.voter account, more than 11.5k STEEM rewarded to a total of 445 users. In the last week a total of 715 posts were voted from a total of 155 users and an approximate 1400 STEEM is rewarded to the authors.
This is a record number for post voted.
Price
All time LEO price
Here is the price chart with proper daily candles.

Last week there was a drop on the LEO price with a huge amounts of LEO dumped at once, but the market absorbed it.
Last 30 days LEO price
Here is the price in the last 30 days.

Alexa rank 764,823, down from last week 653,040.
#steemleo - A Next-Generation Community for Investors

Report by @dalz
Guter Beitrag. 👍