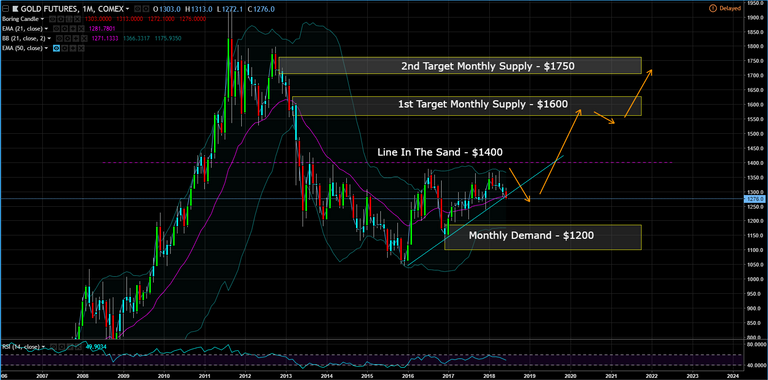
Monthly Chart (Curve) - price is in the middle of the curve, but forming an ascending triangle.
Weekly Chart (Trend) - the trend is up, but price is pulling back into a level on level (one zone on top of another zone) weekly demand zone. The zone at $1355 didn't take out the recent highs at $1368, so wait for price to show you it wants to go higher once price gets into the zone at $1355.
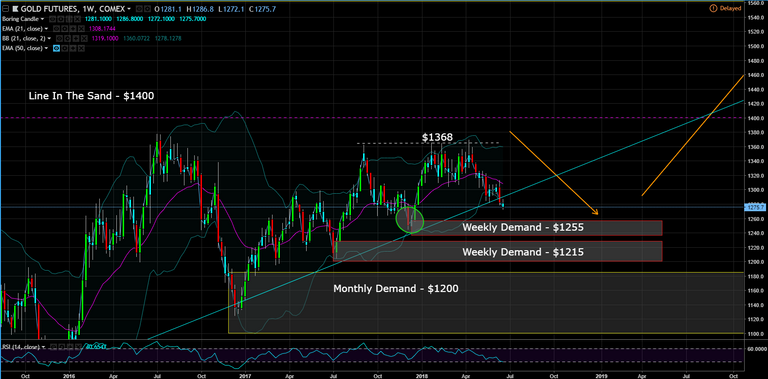
I prefer the lower zone at $1355, because that zone took out the two pivot highs at $1300, but price may not get that low, so I will watch price action if price penetrates the upper weekly zone.

Daily Chart (Entry) - there are unfilled buy orders just below $1250 and $1210. Despite price liking whole numbers (in this case $1200), I anticipate getting a strong reaction to the $1250 demand level. Target 1 is $1315.

This post is my personal opinion. I’m not a financial advisor, this isn't financial advise. Do your own research before making investment decisions.

Upvoted ($0.13) and resteemed by @investorsclub
Join the Investors Club if you are interested in investing.