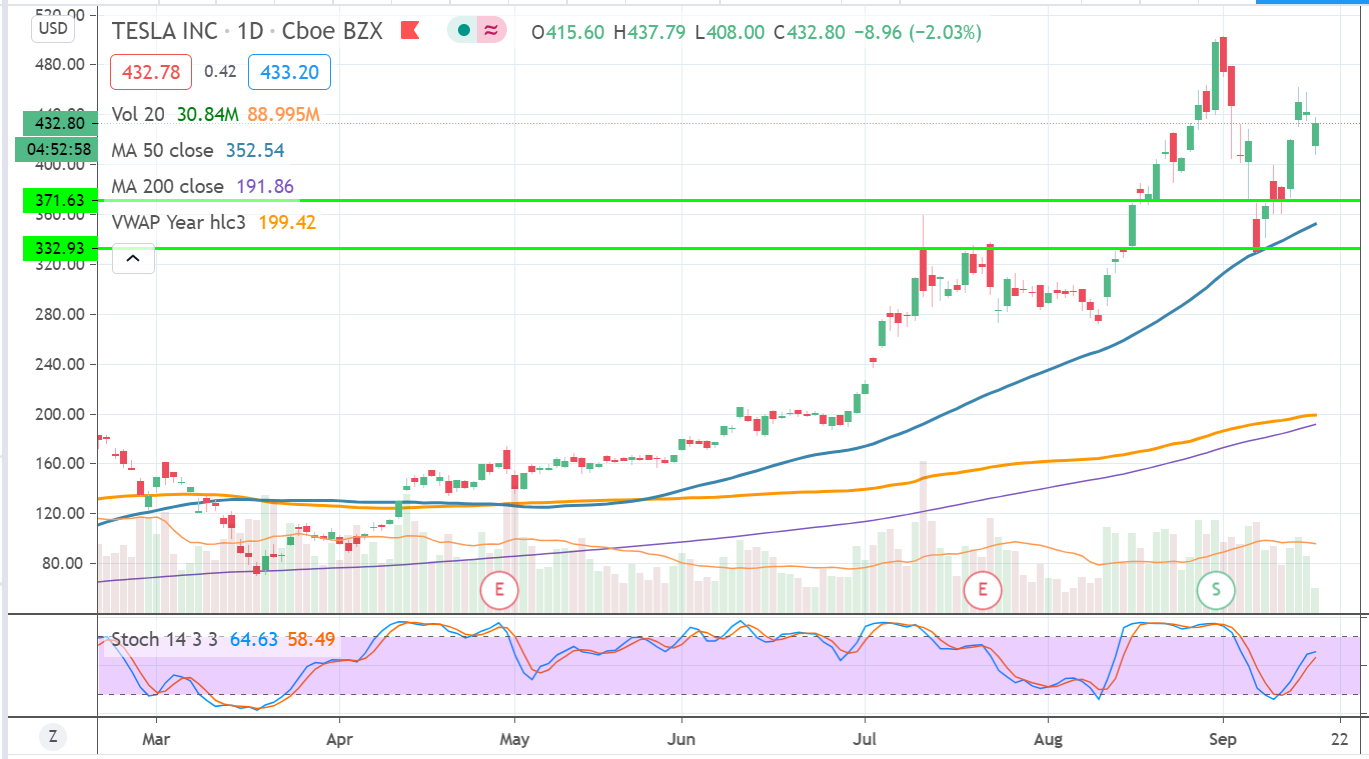
It looks like a descending triangle pattern may be developing in Tesla.
The interesting things that is developing is that the 200 day is looking to cross VWAP soon.
Tesla continues to trade according to the Stochastics.
| Stat | Value |
|---|---|
| PE | 1028.24 |
| EPS | 0.39 |
| Beta | 1.64 |
| Profit Margin | 1.43% |
| Operating Margin | 4.74% |
| Avg Volume | 74.16M |
| Shares Outstanding | 931.81M |
| Float | 740.83M |
| Shares Short | 61.56M |
| Short % of Outstanding | 6.61% |
| Dividend | MA |
| % Held by Insiders | 20.51% |
| % Held by Institutions | 57.93% |
Positives:
- Earnings vs Savings Rate: TSLA's forecast earnings growth (41.2% per year) is above the savings rate (2.2%).
- Earnings vs Market: TSLA's earnings (41.2% per year) are forecast to grow faster than the US market (23.4% per year).
- High Growth Earnings: earnings are expected to grow significantly over the next 3 years.
- Revenue vs Market: TSLA's revenue (23.8% per year) is forecast to grow faster than the US market (9.7% per year).
- High Growth Revenue: TSLA's revenue (23.8% per year) is forecast to grow faster than 20% per year.
Negatives
- Below Fair Value: TSLA ($407) is trading above our estimate of fair value ($131.12)
- Significantly Below Fair Value: TSLA is trading above our estimate of fair value.