RSI is a leading indicator which shows divergences very clear and easy to understand. I explained before a strategy called MACD + RSI
in this post, I explain another strategy based on RSI:

Shifting RSI Trading strategy
RSI is a momentum oscillator that gauges the changes in price and momentum of an index, over 14 period of time, by default, ranging between 0-100 percent.
let's get in to the method. simply call 40-100 the bullish range and 0-60 the bearish range. so we have a mutual area 40-60 percent in both ranges.
So how does it work?
When an index is in an uptrend, the RSI varies from 40 to the top and when in bearish down trend, it oscillates between the bottom to maximum 60% of the RSI.
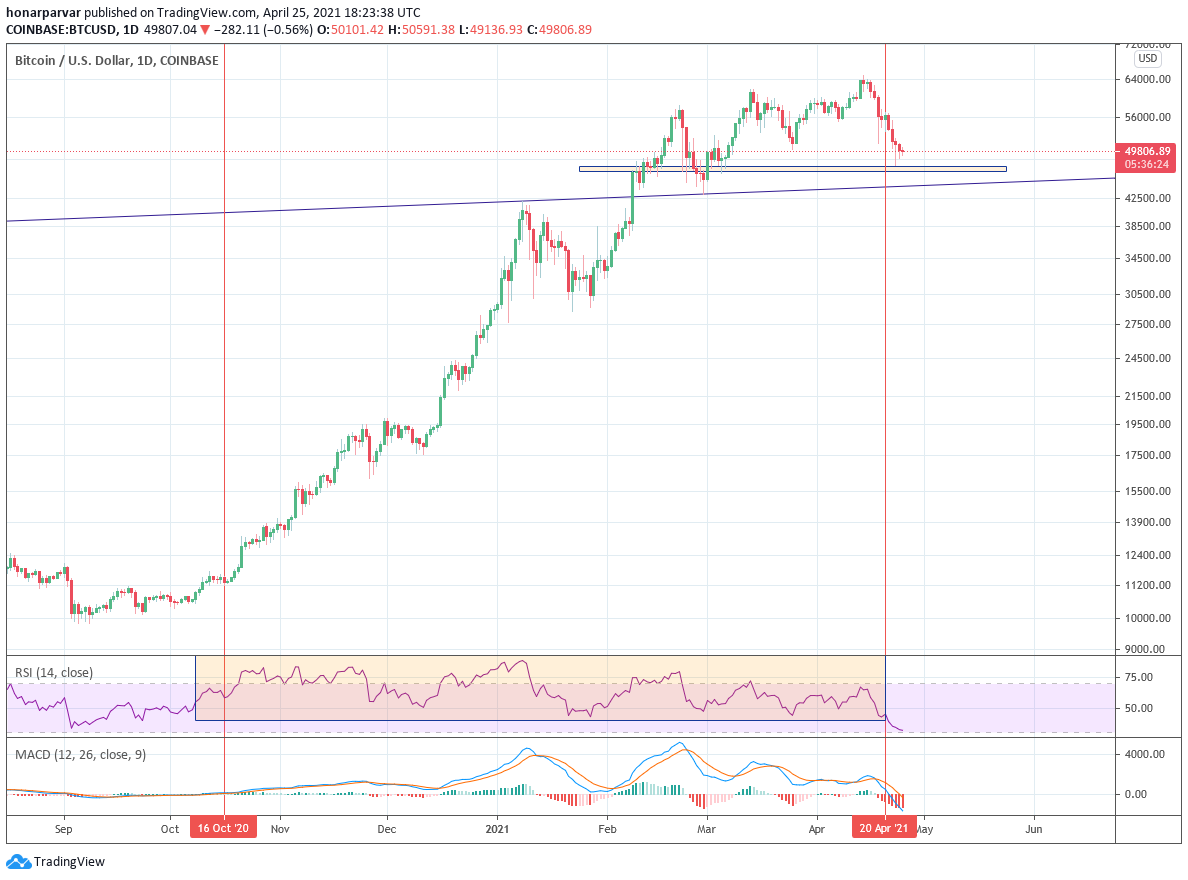
in this chart you can see once the RSI got in to the 40-100 zone and tried couple of lows which didn't break the 40, you could enter long position and hold it till the recent drop of bitcoin. let's say from 11200 USD to 56000 USD.
let's check a chart with a shifting long/short signal:
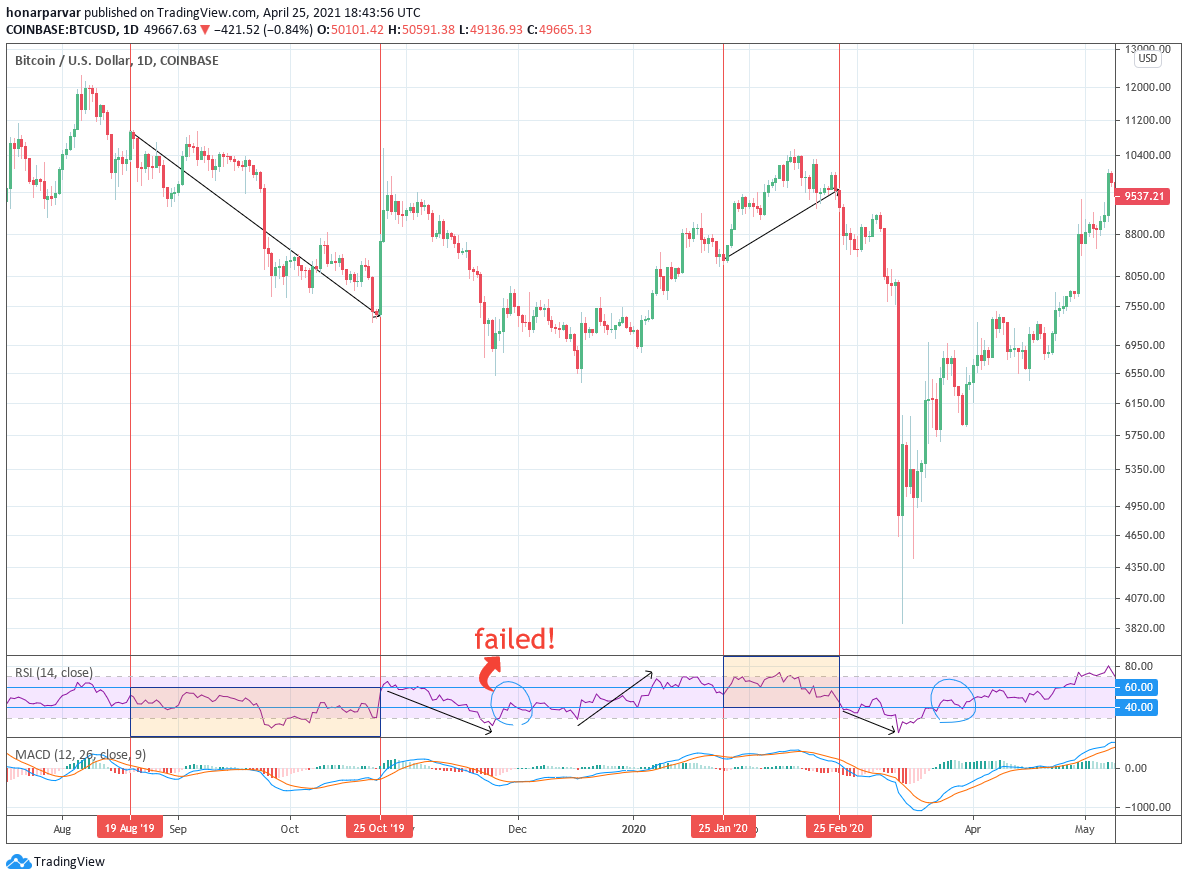
I think the image says it all! we can see how the range of RSI ‘shifted’ from Bearish (0-60) to Sideways (40-60) then failed once to hold below 40 and finally shifted to Bullish (40-100) which was in sync with the respective downtrend, sideways and uptrend moves in prices respectively. another failure is seen after the exit from last uptrend.
this strategy won't give you many entering signals (short or long) but it can get you in to signals which holds a long time with good profit (if you apply it daily)
I haven't tested this method for scalping. this needs to be tested there.