ICON [ICXBTC] has hit an all-time low on 6 feb and the next day a big volume came in. In my opinion that was the bottom and like always, there is only a way to go ( up up we go)
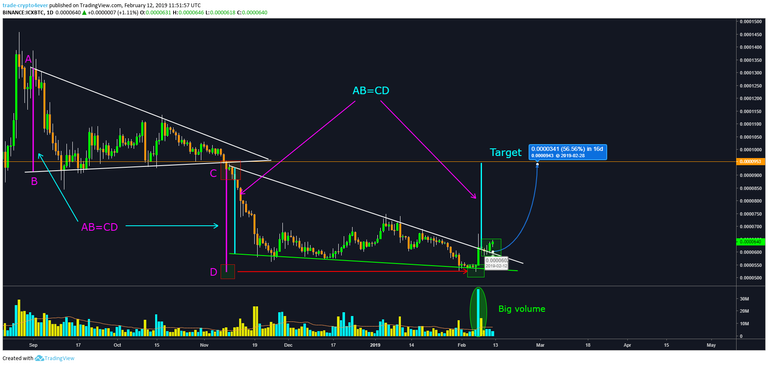
On the chart above:
- In the first descending triangle , we can see a breakout on the down side took place and the price went down.
- In the second triangle, a breakout on the upper side took place and the price will go up.
- AB=CD!
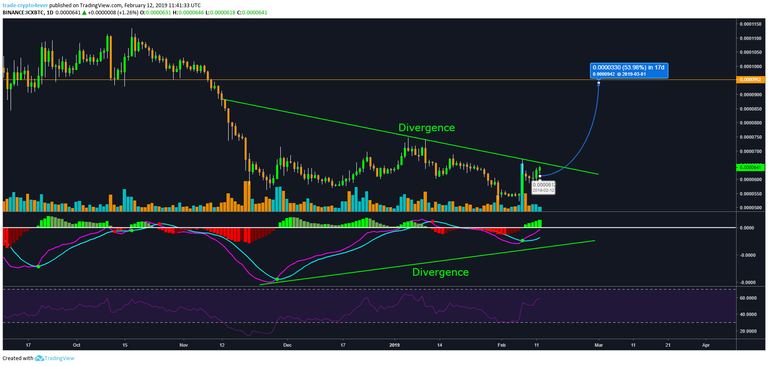
- We have a bullish divergence
- RSI and MACD are also bullish
A clear view of the chart:
Disclaimer :
My posts are never financial/invest advice! For a favorable outcome, make your own research! Never invest more than what you can afford to lose. Don't forget, it's all about positive thinking and patience!
Remember, you should always use a stop loss!
Enjoy the ride!
Twitter: https://twitter.com/trade4btc
Tradingview: https://www.tradingview.com/u/trade-crypto4ever/
Feel free to share your thoughts on the comment section below.
✅ Enjoy the vote! For more amazing content, please follow @themadcurator for a chance to receive more free votes!