
This tutorial is part of a series where different aspects of quickly creating and deploying STEEM web applications by using the Django framework as well as Beem are discussed. Knowledge of programming with Python is advised, as well as HTML and CSS.
Repository
https://github.com/chartjs/Chart.js
https://github.com/django/django
What will I learn
- Installing Charts.js and Django Rest Framework
- Setting up an API endpoint
- Generating charts with Charts.js
Requirements
- Python 3.7
- Django 2.1.5
- Django Rest Framework 3.9.1
- Git
- Pipenv
Difficulty
- intermediate
Tutorial
Preface
The Django framework is quite flexible and can easily be integrated with other frameworks. This allows the programmer to focus on the core functionality while other frameworks can be used for less important features.
Setup
Download the base files via Github and branch to the initial commit. Install the required packages.
$ cd ~/
$ clone https://github.com/Juless89/django-chartsjs.git
$ cd django-chartsjs
$ pipenv install django==2.1.5
$ pipenv shell
(django-chartsjs) $ pip install djangorestframework==3.9.1

(django-chartsjs) $ git fetch origin master b4605e27125712956cf7494d40a529cabd4fc520
(django-chartsjs) $ git checkout b4605e27125712956cf7494d40a529cabd4fc520
Run the server, it should look as follow:
(django-chartsjs) $ python manage.py runserver
Installing Charts.js and Django Rest Framework
The Django Rest Framework will be used to handle the api calls and needs to be added to settings.py.
# dashboard/settings.py

INSTALLED_APPS = [
    .
    .
    .
    'rest_framework',
]
Charts.js requires two changes to the base.html script packages. Replace jquery-3.3.1.slim.min.js with the full version and add Chart.bundle.js.
# templates/base.html

<script src="https://code.jquery.com/jquery-3.3.1.slim.min.js" integrity="sha384-q8i/X+965DzO0rT7abK41JStQIAqVgRVzpbzo5smXKp4YfRvH+8abtTE1Pi6jizo" crossorigin="anonymous"></script>
<script src="https://cdnjs.cloudflare.com/ajax/libs/Chart.js/2.7.3/Chart.bundle.js" integrity="sha256-o8aByMEvaNTcBsw94EfRLbBrJBI+c3mjna/j4LrfyJ8=" crossorigin="anonymous"></script>
Setting up an API endpoint
Create a new view from the class APIView. The view returns data in a JSON format that is compatible with Charts.js. For now the data is hard coded, eventually this should be generated or retrieved from a database.
# charts/view.py

from rest_framework.views import APIView
from rest_framework.response import Response


class ChartData(APIView):
    authentication_classes = []
    permission_classes = []

    def get(self, request, format=None):
        data = {
            "labels": ["Monday", "Tuesday", "Wednesday", "Thursday", "Friday", "Saturday", "Sunday"],
            "data": [12, 19, 3, 5, 2, 3, 10],
        }

        return Response(data)
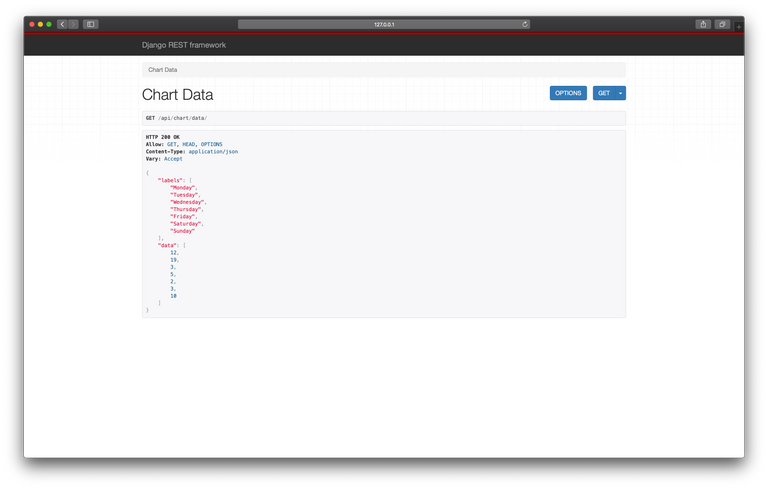
Register the view to the url api/chart/data/.
# charts/urls.py

from .views import HomePageView, ChartData

urlpatterns = [
    path('', HomePageView.as_view(), name='home'),
    path('api/chart/data/', ChartData.as_view()),  # new
]
Validate if the api is working correctly. http://127.0.0.1:8000/api/chart/data/
Generating charts with Charts.js
Add the following container to index.html underneath <div class="starter-template">. The javascript makes sure the entire block is loaded before the code is run. The html centers the chart and fixes it's size.
# templates/index.html

<div class="container">
    <div class="row">
        <div class="col-sm-3"></div>
        <div class="col-sm-6">
        <canvas id="myChart" width="400" height="400">
            <script>
                $(document).ready(function(){
                {% block jquery %}{% endblock %}
                })
            </script>
        </canvas>
        </div>
        <div class="col-sm-3"></div>
    </div>
</div>
Charts.js has examples on their website. Which can easily be adjusted.
<script>
var ctx = document.getElementById("myChart").getContext('2d');
var myChart = new Chart(ctx, {
    type: 'bar',
    data: {
        labels: ["Red", "Blue", "Yellow", "Green", "Purple", "Orange"],
        datasets: [{
            label: '# of Votes',
            data: [12, 19, 3, 5, 2, 3],
            backgroundColor: [
                'rgba(255, 99, 132, 0.2)',
                'rgba(54, 162, 235, 0.2)',
                'rgba(255, 206, 86, 0.2)',
                'rgba(75, 192, 192, 0.2)',
                'rgba(153, 102, 255, 0.2)',
                'rgba(255, 159, 64, 0.2)'
            ],
            borderColor: [
                'rgba(255,99,132,1)',
                'rgba(54, 162, 235, 1)',
                'rgba(255, 206, 86, 1)',
                'rgba(75, 192, 192, 1)',
                'rgba(153, 102, 255, 1)',
                'rgba(255, 159, 64, 1)'
            ],
            borderWidth: 1
        }]
    },
    options: {
        scales: {
            yAxes: [{
                ticks: {
                    beginAtZero:true
                }
            }]
        }
    }
});
</script>
Create a new file charts.html that extends index.html to separate the code for the chart. Put everything outside the <script> tags between: {% block jquery %}....{% endblock %}. Ajax is used to GET the chart data from the api-endpoint and catching any errors.
(django-chartsjs) $ touch templates/charts.html
# templates/charts.html
{% extends 'index.html' %}

<script>
  {% block jquery %}
  var endpoint = '/api/chart/data'

  $.ajax({
      method: "GET",
      url: endpoint,
      success: function(data){
        <code for the chart>
      },
      error: function(error_data){
        console.log(error_data)
      }
  })

  {% endblock %}
</script>
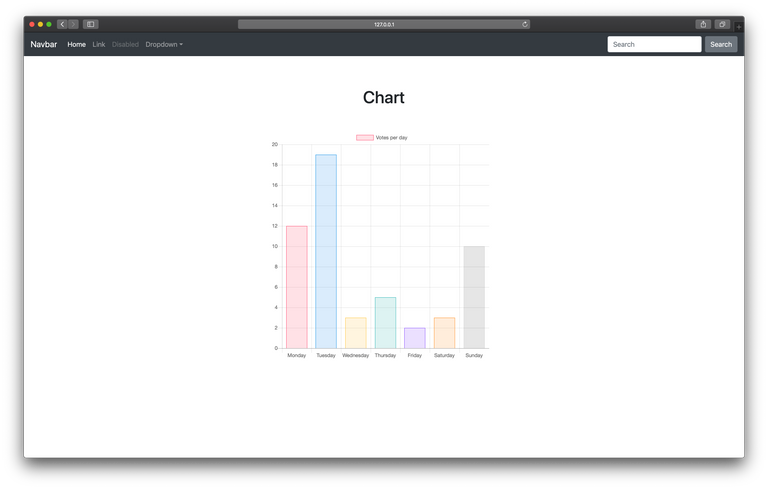
Lastly replace labels with data.labels and data with data.data inside the example code from Charts.js. And set the HomePageView to charts.html.
# templates/charts.html

data: {
  labels: data.labels, #updated
  datasets: [{
      label: 'Votes per day',
      data: data.data, #updated
# charts/views.py

class HomePageView(View):
    def get(self, request, *args, **kwargs):
        return render(request, 'charts.html')
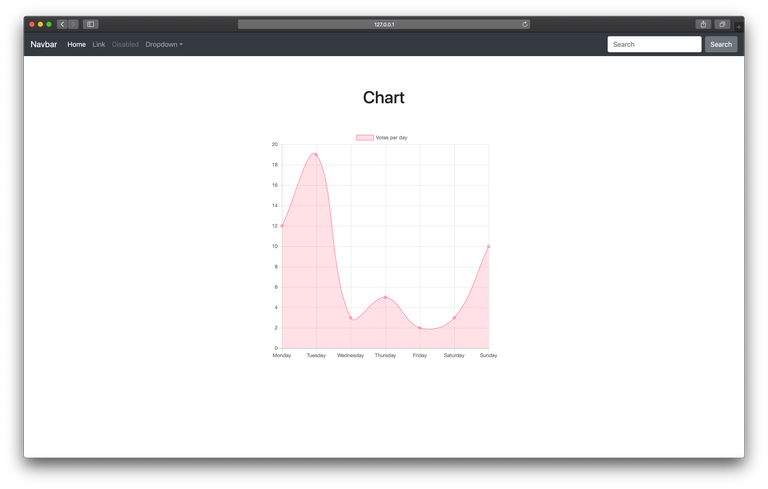
Changing the type of chart is as easy as changing type, for example to line. Check the website from Charts.js for an overview of all possible charts.
Curriculum
- Part 0: Create STEEM web applications with Django and Steem-Python
- Part 1: Using the URL to dynamically pull data via the Steem API and parse to html
- Part 2: Using A Bootstrap Template To Parse STEEM Posts Via Beem API
The code for this tutorial can be found on Github!
This tutorial was written by @juliank.
Thank you for your contribution @steempytutorials.
After analyzing your tutorial we suggest the following:
We suggest you enter comments in the sections of your code. The comments in the code greatly help users understand what you are developing.
In your tutorial it would be important to have more theory about the concepts and librarias you are using. It could explain what APIView is and why it will use it. It could also explain what Charts.js is like other concepts it used in its contribution.
Further detail your tutorial, always think that you are explaining a subject that can appear non-experienced readers on this subject and experienced readers in order to encompass for all readers.
Looking forward to your upcoming tutorials.
Your contribution has been evaluated according to Utopian policies and guidelines, as well as a predefined set of questions pertaining to the category.
To view those questions and the relevant answers related to your post, click here.
Need help? Chat with us on Discord.
[utopian-moderator]
Thanks for the feedback
Thank you for your review, @portugalcoin! Keep up the good work!
Nice work again.
When I was using ChartJS, I didn't make use of a the rest-framework. This looks much easier than the way I got it working. More extensible too!
Thanks! I agree that it is super extensible, this is just a simple introduction. You can pull all the chart settings from a database and play around with the URL path even more. For example: /api/chart/data/<slug:type>/ for different charts.
Hi @steempytutorials!
Your post was upvoted by @steem-ua, new Steem dApp, using UserAuthority for algorithmic post curation!
Your post is eligible for our upvote, thanks to our collaboration with @utopian-io!
Feel free to join our @steem-ua Discord server
Hey, @steempytutorials!
Thanks for contributing on Utopian.
We’re already looking forward to your next contribution!
Get higher incentives and support Utopian.io!
Simply set @utopian.pay as a 5% (or higher) payout beneficiary on your contribution post (via SteemPlus or Steeditor).
Want to chat? Join us on Discord https://discord.gg/h52nFrV.
Vote for Utopian Witness!