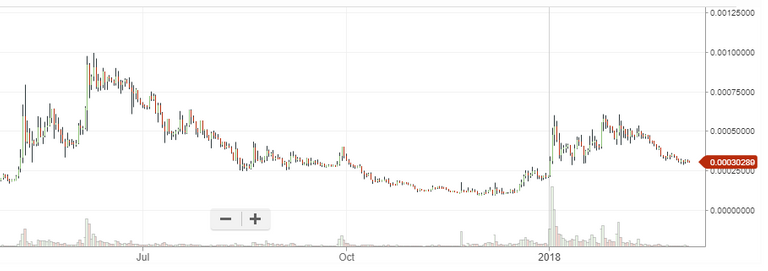
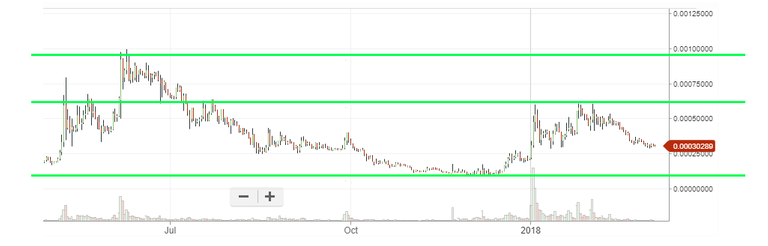
Charts are historical price ranges, got it? Short or long-term, your choice. Take for example, BTC-Steem's daychart:-
Okay, Bob. Now draw a line now across the chart. But what line, you ask? Just draw something. Try it!
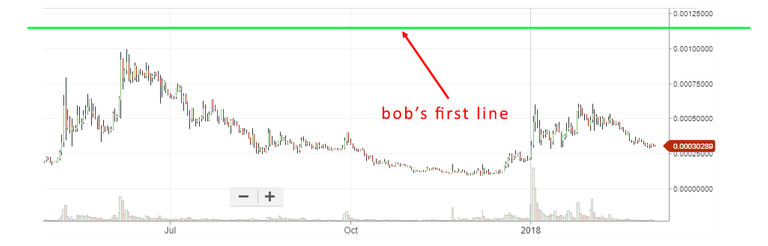
Okay, Bob. Nice line. But why did you draw it there? Try again. Make some sense into your damn line.
Nice, Bob. Now you're getting somewhere. You just drew your line at the highest price point of BTC-Steem over the period of about nine months. I'm proud of you!
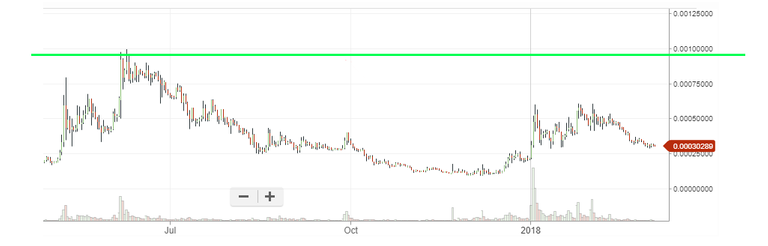
What? You're not sure if you should draw it at 0.000985, 0.000989, 0.000999, 0.00100, or 0.00111 instead of the line you have at 0.000975 now? Look, I'm not a scientist and quantum mathemagician. It's up to your taste in lines. Now Bob, what's the opposite of highest? Draw your next line.
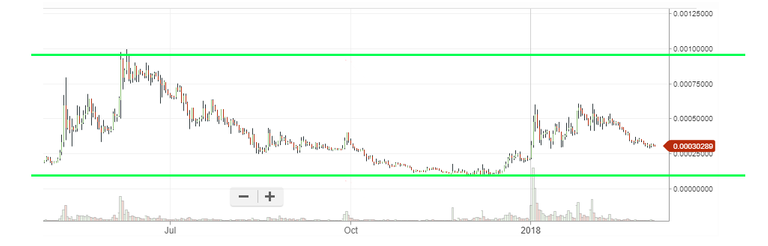
Splendid, Bob. You see, if enough people believe in these lines, you can expect prices to have good chances to react when price reaches these lines. It's best to think of these lines as sponges. Because not everyone draws the exact same lines.
Now, try to draw a line somewhere in the middle. Use some common sense.
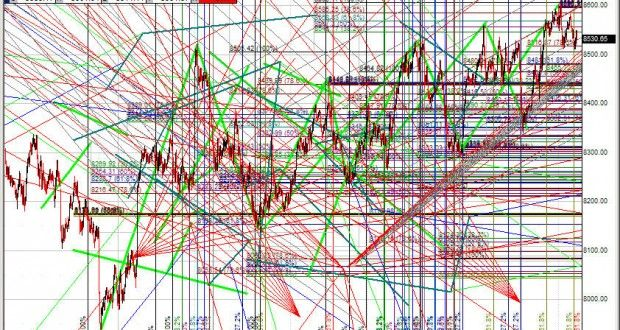
Amazing, Bob! You've connected some nice dots. Let me show you.
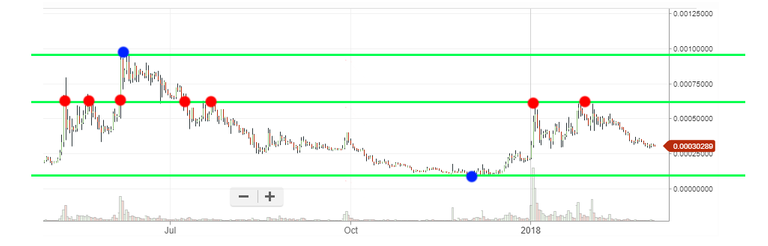
The blue dots just indicate the maximum and minimum price points, hence they're not connecting any dots (although they might). Now, the red dots are the local-maximums and / or local-minimums. You've connected quite a few, so that's great. You're quickly becoming a great line drawer, Bob.
Try another one.
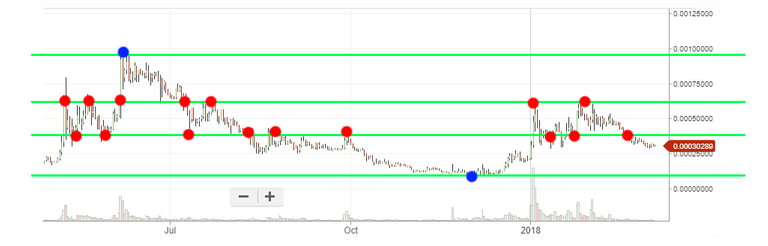
Phenomenal, Bob. Maybe I should call you master Bob soon. What? You're not so sure about the new line since there are sticks jutting out and doesn't look so elegant? Bob.. bob. Remember that the line is a sponge. It's squishy. Don't worry about it. You can draw more lines too if you want, zooming in and out, with different timescales. Even with diagonal lines if you so fancy. But your chart will quickly get cluttered with lines and you'll have to decide whether or not to buy or sell at 0.1, 0.11, 0.111, 0.1111, 0.12, 0.121, 0.12111 or whatever. You get it.
Okay now. If you're desperate and really want to get some Steem right now and profit in the future, these lines are your own guide. Choose a line. Where will you sell?
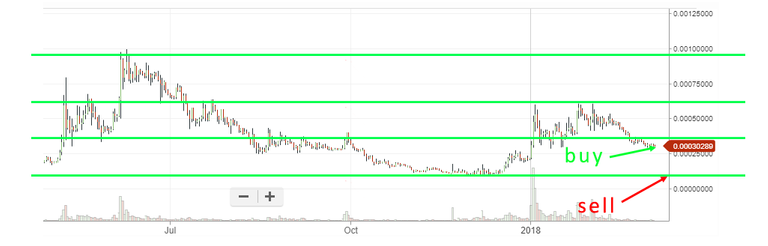
Yes, Bob. That's exactly how you make money. Now give me $200 for the crash course. I won't teach you anymore because that's all you really need for the rest of your life. I'm a simple man. I just buy stuff I believe in and hold long term. No lines needed (well, except to buy low, but why a line again?)
#savetheinternet
#supportcurationworks
#steemsalvation
Am I doing it right?
Is it a good time to buy more?
What do I do!!!
Image produced by me. Not to be taken seriously. Don't do more lines than you can handle. Too many lines could lead to living behind dumpsters. I am not a professional.
No good lines, looks like they can be sniffed up
Lol, i just noticed what it is after seeing ur reply. Oh @nonameslefttouse very poetic
Argh, a good pun of mine got missed then. :(
Don't worry. It's not a photograph of last night's supper. Just some digital art and a stupid joke... LOL
This means you have to go all-in! :P
Good one!....:)...
Those are some quality lines sir. Better than sponges, and easy on the eyes. Sell those lines, and buy more!
Wait for the highs before selling though. ;)
Good one lmao
It's what I do. ;)
ahh the steemit symbol sideways!
What do you think, can Bob make these lines
This is too basic of a graph in my opinion, love the teaching strategy tho.
I like charts for short terms ups and downs.. but still do not understand how to get the most out of reading charts. any good books or videos.. one can recommend.
I do not read too many books but I think this is the best to learn charting: Technical Analysis of Stock Trends by Robert D. Edwards, John Magee, W.H.C. Bassetti. I can't wait to buy this.
Salomondrin and Jon Olsson are making nice videos :D
I listen to podcasts a lot. Do you know Chat With Traders, Bloomberg View, Futures Radio Show or Rob Booker?
Funnily enough I too am a sponge for those lines XD
Ayyy lmao
I always think TA is funny. You can somehow explain everything by a few random lines you draw.
(source: scott adams / dilbert)
lol how smart!
Yeah it so funny
Sorry... Kevin can help for me with Joel
Me when reading TA on cryptocoins:
Hahahahaha, you would have made quite a good teacher. Maybe you should get a school, I'll should send my kids there (that's when I have one).
Back to the lines and graph and chart. I usually believe that life does not holds any permanent formula. What works for Mr A might not work for Mrs B, so I usually learn all this line and chart then discard them for what I believe will work out. Often times people ask me what I think they should invest in. First I'll run analysis of some market for them, then tell them to do as they wish. Time and chance happens to everything.
School of lines? :D Anyway.. It's just for discipline / decision-making, there's nothing much to TA. It's mass psychology.. i mean if everyone thinks the same, draws the same lines, and makes the same decisions.. but there's just so many different kinds of lines out there.
had to switch hands I wrote so many of them :(
@kevinwong I love keeping things SIMPLE too. Just like Life...it was meant to be that way.
Human beings just love complicating things. And that's another place where opportunities exist. In our challenges. 😊👍🏻
Drawing lines...always tells a story.
Mel @coachmelleow
Awesome tutorial on technical analysis, now I have the skills to predict the future price of Bitcoin!!!!
But seriously, this was super entertaining to read, and the satire is hilarious. It's striking how many people out there claim to be able to predict the markets by drawing a couple of lines, triangles, etc... Although I'm not discounting technical analysis as a legitimate aspect of cryptocurrency trading, the absurdity of some of the stuff out there is unbelieveable!
I sure wish Bob all the best for his future journey with cryptocurrency, he sure needs it!
Cheers, Kevin.
There are many kinds of lines, and horizontal lines are most basic when 99% of people look at charts i think. anything more fancy is just wishful thinking (or profiting from others piling on your popular trend lines). I wish Bob success too!
You forgot to tell Bob that his lines work best on longer time-frames. Anything less than a daily chart becomes more speculative and if he's looking at hourly charts or less the lines don't really work all that great.
Of course Bob jumped right into the markets using tick charts - "I'm gonna be rich next month" - and now he thinks you scammed him out of $200. :D
LOL, next month is pretty long. I think these days is moon-lambo potential within 18 hours, what're you talking about??!
Oh, now we're talking the golden moon-lambo triangle? I don't know if Bob is ready for such an advanced charting technique. I mean there's only technically a 23 minute window when it's really accurate, and he would need to draw all the lambo fan lines, as well as the 15 degrees of mooning.
And then there's the equity investment bag holders ratio (EIBHR) to consider. Do you think Bob is ready for this?
Lol was this seriously peddled out there?
LOL. No, it's my own made up hyperbole :)
lol. Hold on Bob. maybe it's not so black and white. Oh and hey Bob, you might wanna do the opposite with the whole buy and sell bit. There's a big hole of sarcasm in front of ya. lol
I loved the simplicity he put in this post. Even i who doesn't know a thing about TA got a hold on how it works.
@kevinwong's explanation was perfect. Not only for those new to TA, but even for some who've had experience with it, but get caught up in the whole indicators trap. That's where the sarcasm came from. Even an experienced person could benefit from his explanation, because it would prompt them to clear their charts and trade with simple indicators (support/resistance). Simple is often best.
Lol, this is an exceptional explanation in very simple terms. I didnt know that before, didnt know how the "mathemagician" come up with their things... thanks alot. Here is your $200..
Bring the 200 bucks here. Am applying to work as his accountant.
Hilarious. Great lessons comes simplified, unfortunately we only know Bob, the master remains unknown. Regardless, thanks master, lessons well taught and digested, now a NOOB can make a conscious buy and sell decision. I'm off to the exchange market.
LOL! We shouldn't just draw lines, it's a combination of lines, trend channel, MA and candle stick patterns like the classic Pin bar at the daily chart.
BTFD
lool, you are so right. The only strategy that has worked so far is holddddddddd. I do remember in the early days when you bought a lot of steem at 3 something usd...You kept it for over a year, I dont see graphs anymore, just fundamentals, people that are involved in the project and intuition for the kind of project the cryptocurrency is created
I think 90% of the time,will lose trading..
You seem to be an expert in drawing lines.
Could you help with a project? ;-)
Haha that was painful
Some years ago I do a trading course at a local gathering of traders, some advanced and some beginners such as myself. It's interesting to me that here in your 7th graph example that you have dotted the double tops and double bottoms.
This is a method I have used now quite successfully to trade since then. I have had several major "Wins" and some major "Losses" but over that time the Wins have far outnumbered the losses. Many traders over the years have recognised these markers and many good courses have been built around the successes of recognising the "Double Top" and the "Double Bottom".
Thanks for the neat example here. Well done.
Oh that's a double top and double bottom? Never knew that.. this is the only TA that made sense to me since forever, as I approached charts like a caveman who knows nothing when facing a chart..
When I trade Kevin, I look for 2 points close to each other and at almost the same level,. Usually if I see 2 tops then I watch for a down trend and then look at where it rises, if it passes the pervious top point I wait for a 1 third past that top and then buy in. I do the reverse for two points that are on the downward trend. If the market or stock I am looking at is bouncing all over the place I leave it alone. Really not a good explanation but I found it works pretty well. I have been looking closely at the Steem graph to see if I can decipher much from that. Since I'm brand new here I'll take some time to learn it all, I'm really looking for instances where when I cash out my dollars I get the best price if that makes sense.
Hahaha! This is brilliant! If Sponge Bob gets it, then there's hope for me yet!
LOL. Okay you've won the first prize for connecting the dots between sponge and bob! :P
lmao, quantum "mathemagician." I must admit, drawing lines at highs/lows and finding the point of intersection sure does look impressive.
To be honest, I think the technical analysis achieve one thing: whatever you draw, that is what people will believe to be true and therefore invest/sell. If you can draw some lines to show an uptrend that reaches a certain value, then people will buy and make it a self-fulfilling prophecy.
The same can be said about authority figures in the cryptospace. If you have John McAfee say "bitcoin is going to $45,000," people think that he came up with this figure using some kind of analysis. The truth is, people don't know value and will pay however much they think it is worth. If someone like John McAfee says it's worth $45k, then that is what people anticipate the price to go to. It is a self-fulfilling prophecy.
And yet people are still believing in TA, why? Because there are millions of TA and somehow some of them will got it predicted accurately. People need to realize that seriously.
If in south east asia, i remember people paying to see "masters in the temple" for lottery prediction fml. It's like that..
Or you have a dream last night? Here is the book for all the number you should buy for the lottery. Simply genius.
also, it was not so terribly hard to make profits form crypto trading in 2017, when about ALL of the coins went sky-high.
The problem is not TA.
The problem is bullshit TA. Drawing lines as you Will on a graph doesnt make It technical analysis.
TA is nothing more than a statistic treatement of past price data. If uses bullshit data, the result Will be bullshit.
Here, check this post where i explain one technique.
Its Basic, have flaws, but work If the price is moving on a Trend.
Also, TA doenst move prices. Volume of transactions move prices. The indicators give probabilities of Future movements based on historical data.
Btw, Quantum events? Never heard of a bigger bullshit.
The hardest part is we do not know whether it is BS or not as BS is everywhere.
Dont follow blindly. Learn and question.
I was drawing bottom lines back at august. It indicates where the character sits. At the top line is where she takes her head out to breath.
from a painting I did for steemit. I named it floating if I remember correct.
How many paintings u have so far? the finished ones
full sized canvas kinda recent job that I did for steemit, about 5 I think, I gifted one of them recently to a friend.
Can confirm this works: am a billionaire.
Seriously, haejin must be laughing his ass off at people who still vote for his posts after reading this.
Now, if only you had added comedyopenmic as a tag: FREE SBDs for this quality entry!
EDIT: LMAO there are actually people thinking this is an actual analysis. SMH
Haha i'm seriously out of touch with the tags! I noticed this one though :)
Yeah.. I think sarcasm isn't something universal.
Nice, would you like to be a judge for the next round? The entries will make you forget all your week's troubles and you'll surely crap out your intestines reading them, they're that horrible.
Jk jk they're awesome :P
True, sarcasm is preferred by less and less people in these times. I got my ass handed to me once because of using it haha.
Dangerous stuff I'll tell ya.
(I still mess with it though)
Thank you, @yesaye, but please try to only invite people to enter the #comedyopenmic contest, not be guest judges. The contest isn't at the point yet, and we don't want anyone getting the wrong information.
Ah sorry! My bad.
Will keep that in mind.
It was all that excitement's work.
haha I'm alright, I think there are better judges for wit and comedy :D i'd read them though!
Awesome, no probs, it's a pleasure having you as an audience! Gotta up my game this week to impress ya then.
(And maybe end up in that sweet sweet auto-vote list mhhmm yeaa)
😂
Seconded! :D
Been reading your comments. Keep it up sir.
Woah! That's an honor @pangoli. Thank you for thinking so! :D
I don't know what that means in your profile pic, but its dope
Actually, that's exactly what it means: dope avy.
Haha, it's the initials of my username, 'YesAye'.
Notice the Y and A. ;)
WOW! well I didn't see that coming. Well thats the perfect symbol for it then thats for sure!
Buddy you're giving me way too much attention than I deserve.
(which is, -1)
But, if I keep getting those fat, juicy upvotes then, why the fuck not?
WELCOME ON BOARD, JUICE IS HERE SNACKS ARE HERE EVERYTHING IS HERE
(fine print) No really i'm just bored and can't find any other good content to upvote, so I go look for new friends when this happens hahahahahaha.......hahahaha.aaaa ehhhhh
Trust me, there are better ways to find friends than this.
Right now, you're only attracting money hungry douchebags.
(read: me)
You could join the Be Awesome community if you'd like. :)
It's by @whatamidoing. He's also got this thing going: the Deadpost Initiative which is awesomely helping minnows, so do check that out. :D
(too late, we're already friends, no running away now mwhahaMWHAHA)
You truly deserve $200 for this knowledgeable crash course but on Steemit you have to be satisfied with an upvote Bob...hahaha!
If your upvote isn't worth 200 bucks, then you'll have to pay in instalment for three months.
You told me not to take this as financial advice, so I have to admit that I didn’t listen to you, and your system made me eleventy gajillion pesos.
So here’s my plan...I’ve heard there’s a “Technical analyst on here ::giggle giggle:: named “Hedging” or “Hogging” or something, and that he gets his funds from RanchoRelaxo, which is, of course, my main competitor in the luxury travel plans sub-market.
So if you keep putting up such wonderful financial advice, you can expect MASSIVE profits coming at you from a REAL place of luxury and relaxation only a quick planet express trip over to the beautiful Spa 5.
Don’t be scared Rancho, I’m sure you can start a salad dressing company once Spa 5 gets the Michelin Star you’ve coveted for years.
I'm not sure what the story is, but I definitely see it as an attack on the network.
And once you got the basic straight lines down, can start getting a bit more creative - i.e...
rare unicorn pattern??
This is a bit more rational type of trading, reading between some lines. And I believe this is for someone in the platform who does the opposite way and to everyone who thinks that someone is genius in TA trading. Wake up people!
Just my 20cents opinion. :)
Hehehe you will make an excellent teacher really... $200 isn't bad to give for the crash course looking at how you took your time to explain and make it practical. Nice one bro.
A great lesson, my friend and you are absolutely right that the graphs are of great importance in trading, as it is possible to predict the volatility of prices in a certain analysis. Continue you very well get to explain the state of things when trading! Thank you @kevinwong
I'm actually 99% fundamental analysis and only 1% technical because i don't trade everyday or week.. only to determine my longterm entry and exit.
Masterfully crafted simplicity.
The ability to present the highly complex in a manor understood by a child shows an exalted level of intelligence. That’s real talk.
Thanks and praise 🙏 This knowledge is my gold and will help in my attainment of future wealth.
It is my desire to one day be able to return the favor. Regards. V
Haha but seriously, if you zoom in or out of charts, there's just another minimum/maximum so that's all there is to lines.
Praise!
haha i though crypto price depend on demand and supply but now i think it depend on ..triangle, downline,upline ,waves...lol
5000X profit chart
It's beyond demand and supply and quite a complex analytical concept too
Lol
This is the holy grail, aye stop giving away our secrets!!
But I only have a couple of dollars, I can't pay for that crash course :((
Damn, have to take my moms credit card again!
It's already paid for ;)
Support and resistance is probably the only valid TA around. Anything else i like to call 'financial astrology'.
give a caveman a chart, this is probably the most basic thing they'll draw as well.
Haha... I love Bob!!! Is he a mannequin like me?!? Looks like we do the same TAs, haha!
Plastic hug
Steemitri The Mannequin
Oh hey, we meet again Mr.(/Mrs.?) Mannequin!
Performing stupid TA doesn't mean all TA is stupid. Anyone can self-sabotage something and go, "Look! It's bullshit!"
That said, Elliott Wave is tea-leaf reading nonsense. lol
It's being popularised in crypto for a reason
Damn, Bob is really good at drawing the lines!
I wish I was so talented in it, maybe I could finally become a painter :((
I agree, just buy low and hold is a good choice lol.
Greetings, man.
I understand fundamental analysis. Technical analysis I understand almost nothing. I'll test your technique to see what it looks like. Thanks a lot for the help.
Good Morning!!
It's the most basic and probably only one you need :) all the best!
ok, thank you so much for analysys, man!!!
TA is not a science it's an Alchemy. We are the magicians of TA, secret cult.
Is it real? Can I do that too? I have never tried it until now. Maybe I can start with your guidance! Thank you sir, best regards.
Yes, but the lines are not real, just if you need some guidelines yourself
I will try it, thank you.
This was hilariously explained,but with great education.
Bob's first line was just out of order hahaha
I did not know this analyis honestly and thanks for the crash course.
I'll use both of the blue dots as a reference to buy or to sell, get the max profit that't what I mean. Crazy idea, but its just like fishing. Now that's the mind of a fisherman and not a businessman....that's me. Thank you for the crash course, but like Bob, I don't have 200 to pay you, just a 0.01 upvote.....
it is the point of support and resistance, in the point that's market will always spinning when market sidway.
You have simply put it out quite easily how it actually works. Any one can be a Master Bob from just being a Bob like that. For sure you deserve dollars for such a rapid crash course. The lines really depict if you buy some steem when you should buy and how are you going to profit in future. But i wander should selling line be on the lower side. How can it profit?
Haha i was just making a joke
Hahaha a joke but it does make a sense. The lines look real.
Technical Analysis can give you some signals to buy in a better spot and sell at a better time, but the reality is that no one can predict the future, so the only rule you should follow is buy low and sell high, and that´s it.
From now on I won´t face my friend Bob with the some spirit anymore, now he will look like a "genius" compared to me :D
Poor Bob, after you lightened his pocket of 200 bucks he now thinks he should buy high and sell low.
Maybe you should teach him how to hodl, for a fee of course :))
the best teachers teach the opposite ;) let em figure it out
he was paid in shitcoin lol
This is the shortest best technical analysis that I have read since I came to know about crypto currency. Thank You very much. I will practice it. Awesome job @kevinwong.
Funny indeed, got me going for a while there...
I'de say, BUY big time... I dared to put some diagonal line in the charts :)
This post made my day. Makes for a much better life style when you have less lines to worry about.
Haha definitely. Don't box anything in with lines..
yes, that was bloody fun kevin ;)
There is another form of analysis I read about, a couple of years ago. Fundamental Analysis. This form of analysis is based on the "traditional" tools of business accountants use all the time, and sounded more "true" to me.
But here on steemit, TA seems to be the way to go for a lot of people. I really don't know why.
Because some people made big bucks back when there was a bull market.
I like you bob for your simple explaniation. I think this way works more with long term investments liek you mentioned. but it most simple and infromative way I seen before. like this you can see how much you will lose in bad situation and gues if you afforad that not? you can expect risks or benfites range. so at least you will have genral idea. I think crypto trading isn't like forex its different and candles never show you accarute resaltues. so investing in long term is best way to earn in crypto world. thanks Bob. keep going Bob cuz Like this word u made me smile several times reading it ahhaha lol
Yeah, crypto isn't a mature market yet, wait a while longer then it should end up being more stable. but what do i know? lol
We can't give you 200USD, only 200SBD.