
Welcome to the daily financial report about the Hive blockchain.
All the information presented in this report is based on the data collected from the blockchain until 2023-07-18 midnight UTC. This report aims to provide you with a clear view of what is happening on the Hive blockchain.
 Este post está traducido al español - aquí
 Dieser Beitrag ist ins Deutsche übersetzt - hier
 Une version en français de ce post est disponible - ici
1. Price
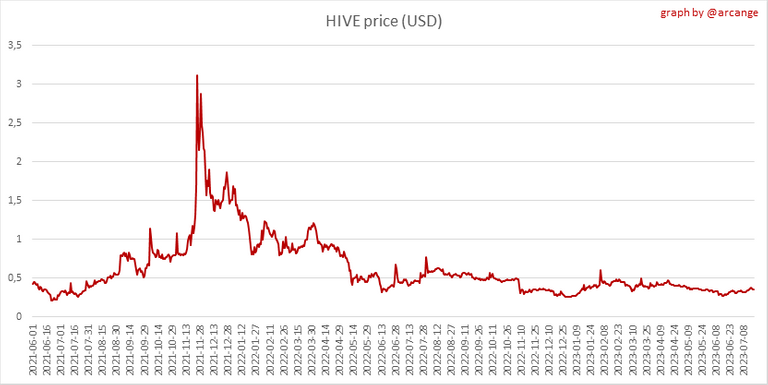 | 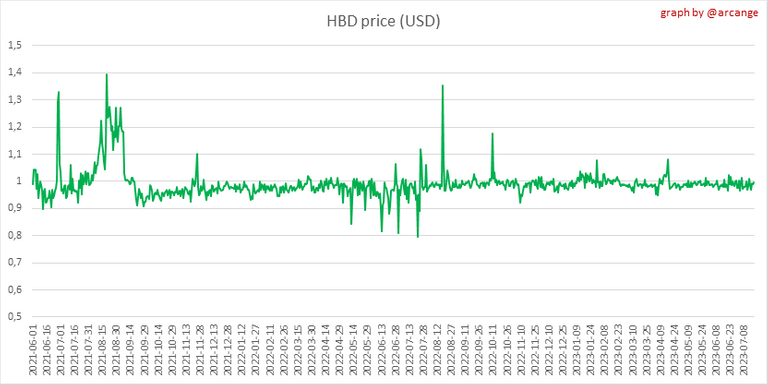 |
These graphs show the evolution of prices in USD for HIVE and HBD.
2. Supply
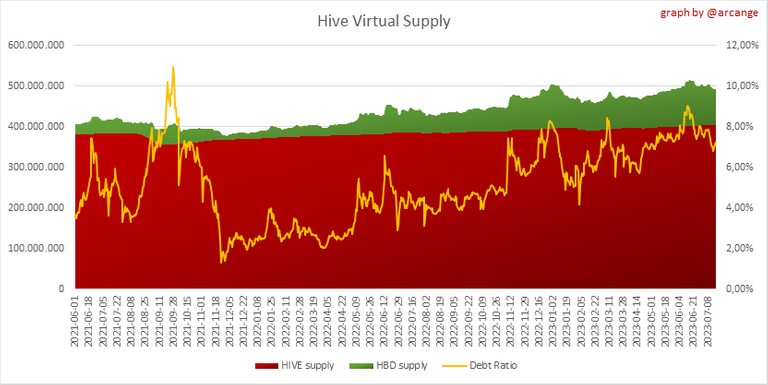
This graph shows the evolution of HIVE virtual Supply. The virtual supply is the sum of HIVE supply (liquid and staked HIVE) and HBD supply (converted into HIVE).
The graph also displays the debt ratio (HBD supply / HIVE virtual supply). Keep in mind that since hardfork 24 funds in the treasury (@hive.fund HBD balance) don't count towards the HBD debt ratio.
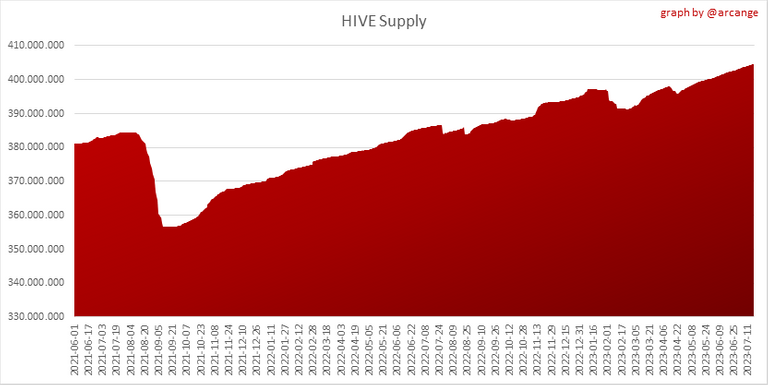 | 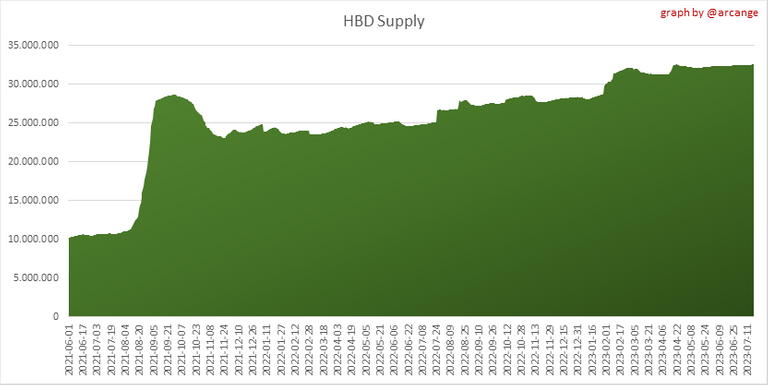 |
These graphs show the evolution of the HIVE Supply (both liquid and staked) and the HBD supply.
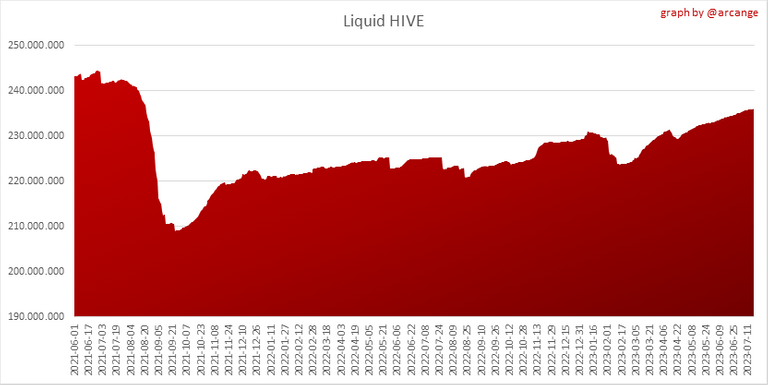 | 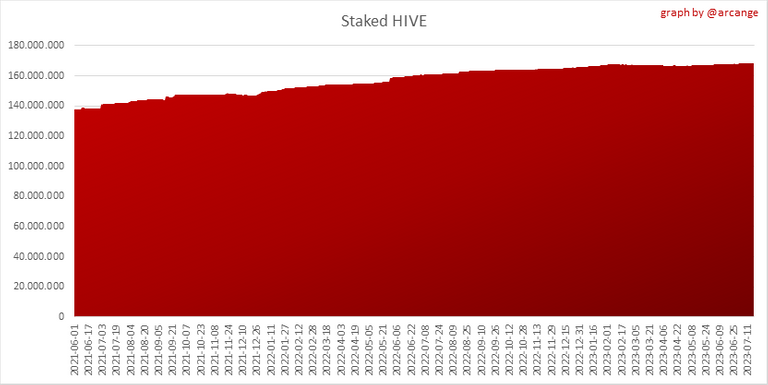 |
These charts show the evolution of the liquid HIVE and the staked HIVE (Hive Power).
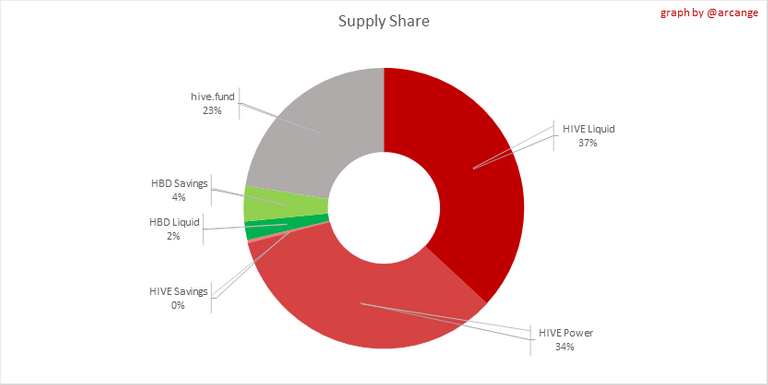
This graph shows the overall Hive tokens distribution.
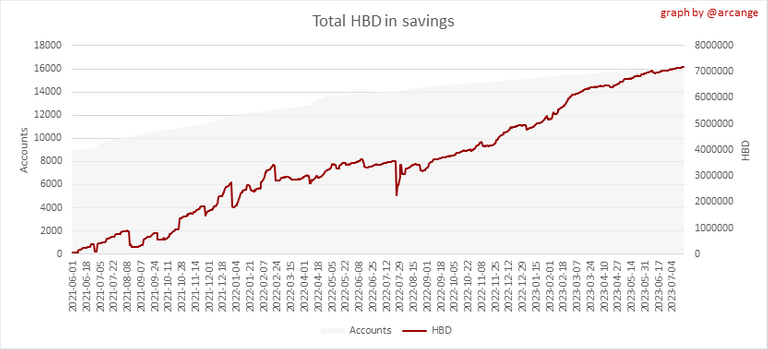
3. HBD Savings
| Account | Deposit | Account | Withdrawal |
|---|---|---|---|
| @fractoli | 1,000.000 HBD | @lunaticpandora | 3,013.693 HBD |
| @rotanner | 689.592 HBD | @etherdex | 674.719 HBD |
| @shinoxl | 656.586 HBD | @readthisplease | 149.284 HBD |
| @astralrevelation | 507.905 HBD | @demotruk | 100.000 HBD |
| @clau-de-sign | 415.481 HBD | @edex | 100.000 HBD |
| @hiveauth | 324.984 HBD | @anandkj611 | 100.000 HBD |
| @kennycrane | 225.009 HBD | @sinistry | 60.000 HBD |
| @hivesql | 135.000 HBD | @daddydog | 49.974 HBD |
| @sourovafrin | 85.337 HBD | @liseth.zamora | 36.492 HBD |
| @stevenseagull | 76.697 HBD | @kothy | 34.335 HBD |
This graph shows how much and how many accounts store HBD in savings. The table below shows the topmost HBD deposits and withdrawals of the day.
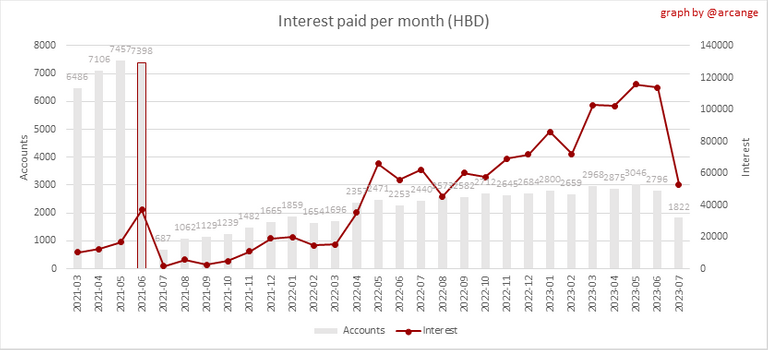
Note: As of 2021-06-30 (HF25) interest is only paid for HBD which are stored in savings.
This chart shows the amount of interest paid each month for holding HBD and how many accounts received such interest.
4. Balances
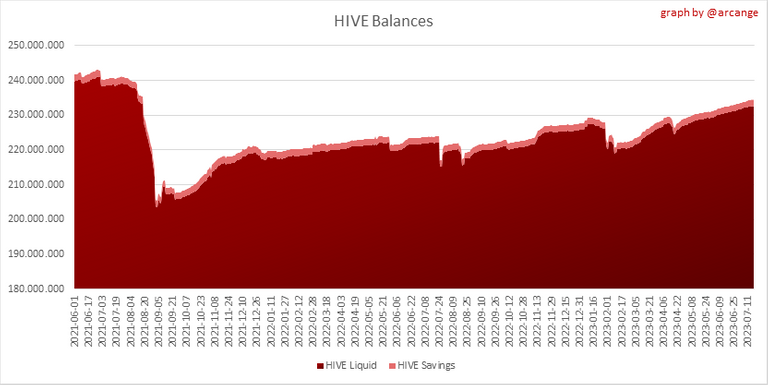
This graph shows the number of HIVE, both liquid and in savings, held by all accounts.
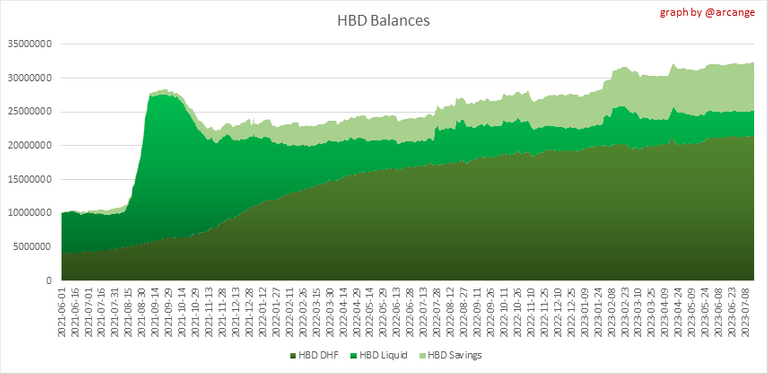
This graph shows the number of HBD, both liquid and in savings, held by all accounts. It also displays the amount of HBD stored in the Decentralized Hive Fund (DHF).
5. Conversions
Note: As a reminder, conversion requests are only finalized after 3 days. It is only then that it is known exactly how many HIVE were burned in return for the HBD received at the time of the conversion request.
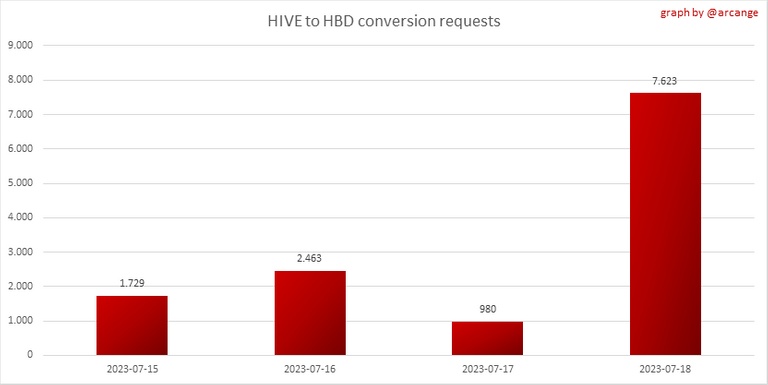
This graph shows the number of HIVE collateralized due to requests to convert HIVE to HBD over the past few days.
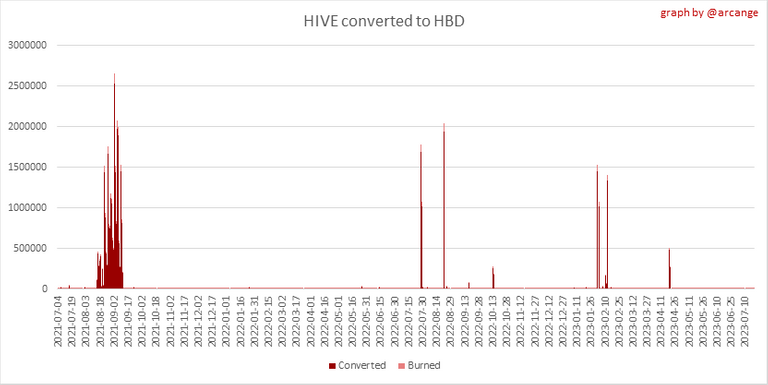 |  |
These graphs show the number of HIVE effectively used by the conversion process (HIVE converted and 5% HIVE fee which is burned) each day and month when requests to convert HIVE to HBD have been finalized.
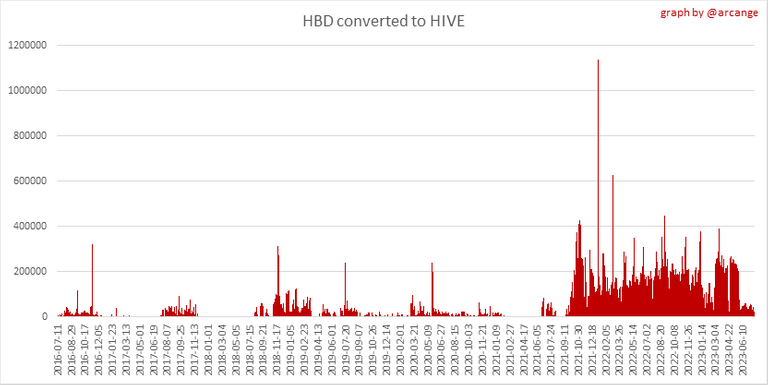 |  |
These graphs show the number of HBD burned, each day and each month, following requests to convert HBD to HIVE.
6. Powerup and Powerdown

| Date | Account | Amount |
|---|---|---|
| 2023-07-18 08:18:36 | @psyberx | 30,643.049 HIVE |
| 2023-07-18 04:16:45 | @apshamilton | 26,025.908 HIVE |
| 2023-07-18 01:15:57 | @johnjgeddes | 6,009.551 HIVE |
| 2023-07-18 11:43:57 | @ninnu | 2,000.103 HIVE |
| 2023-07-18 07:41:15 | @alexko-steemit | 1,920.048 HIVE |
| 2023-07-18 08:49:06 | @sicarius | 1,583.509 HIVE |
| 2023-07-18 06:55:48 | @lxsxl | 1,300.088 HIVE |
| 2023-07-18 06:32:09 | @omra-sky | 1,300.037 HIVE |
| 2023-07-18 01:36:09 | @silviabeneforti | 1,264.609 HIVE |
| 2023-07-18 05:10:54 | @sholex94 | 1,213.090 HIVE |
This graph and table show the amount of powerdown initiated over the last 7 days, and the largest initiated on this day.
| Account | Powerup | Account | Powerdown |
|---|---|---|---|
| @rotanner | 2,596.497 HIVE | @appreciator | 20,103.929 HIVE |
| @demotruk | 867.602 HIVE | @therealyme | 13,955.039 HIVE |
| @nuthman | 507.251 HIVE | @leo.voter | 5,405.808 HIVE |
| @deanliu | 500.000 HIVE | @bdvoter | 3,973.348 HIVE |
| @norwaylife | 499.790 HIVE | @quochuy | 3,706.365 HIVE |
| @xawi | 465.197 HIVE | @hivelot | 3,473.249 HIVE |
| @xbr14 | 343.107 HIVE | @therealwolf | 3,030.728 HIVE |
| @dwayne16 | 217.913 HIVE | @ocd-witness | 2,888.715 HIVE |
| @kachinhenry | 205.587 HIVE | @anomadsoul | 2,285.925 HIVE |
| @jeffjagoe | 205.517 HIVE | @netaterra | 2,119.349 HIVE |
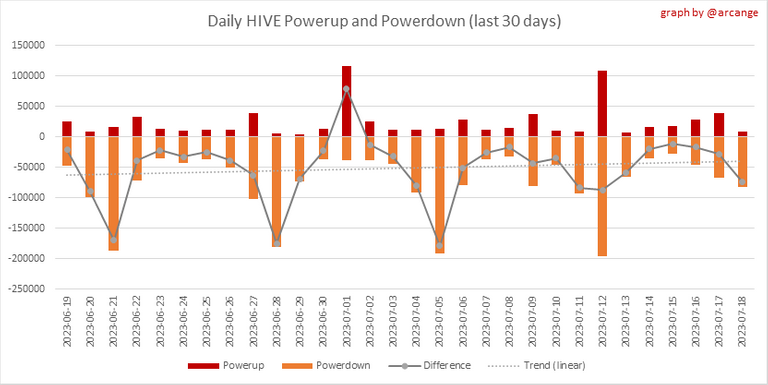
This graph shows the daily HIVE power-up, power-down, and the resulting variation over the last 30 days. The table shows the topmost power-ups and power-downs of the day.
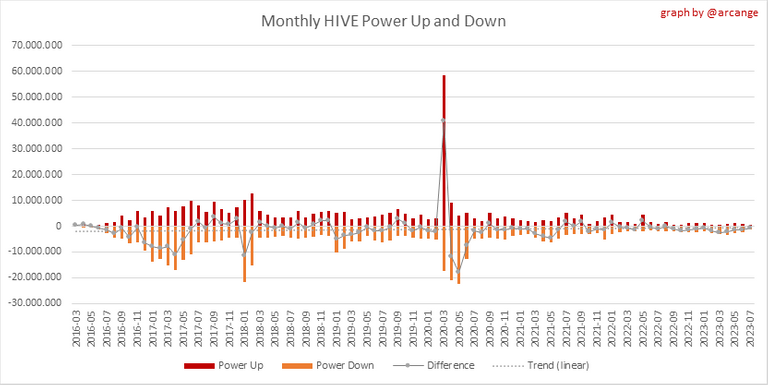
This graph shows the monthly HIVE power-up, power-down and the resulting variation.
Values for the last 3 months
| Period | Powerup | Powerdown | Difference |
|---|---|---|---|
| 2023-07 | 515,834.000 | 1,291,880.000 | -776,046.000 |
| 2023-06 | 935,720.000 | 2,272,560.000 | -1,336,840.000 |
| 2023-05 | 1,244,290.000 | 2,551,773.000 | -1,307,483.000 |
7. Transfers
These graphs show the volume (in USD) of HIVE and HBD transferred between accounts.
8. Exchanges
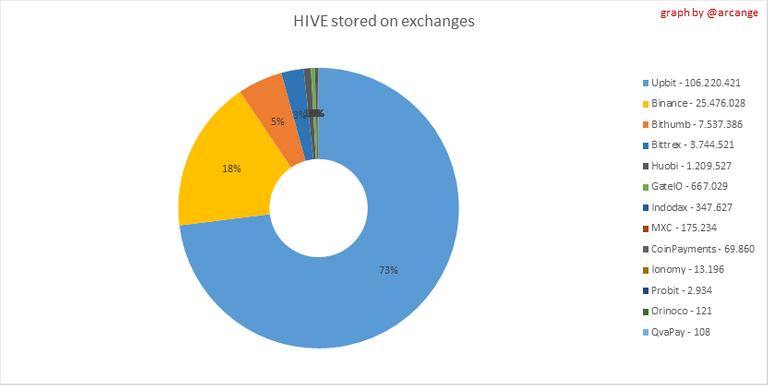 | 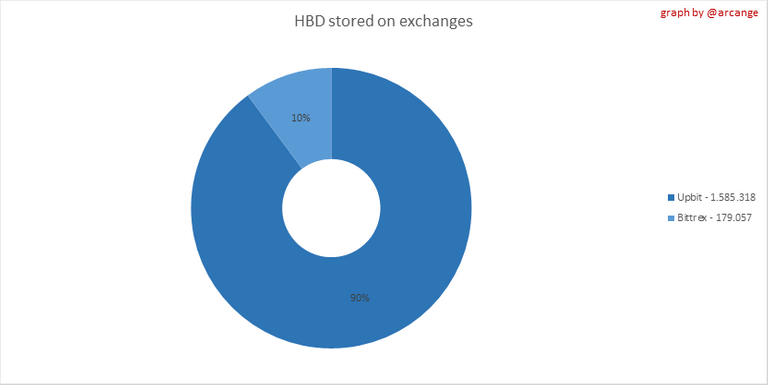 |
These graphs show the amount and distribution of HIVE and HBD stored on the exchanges where they are listed.
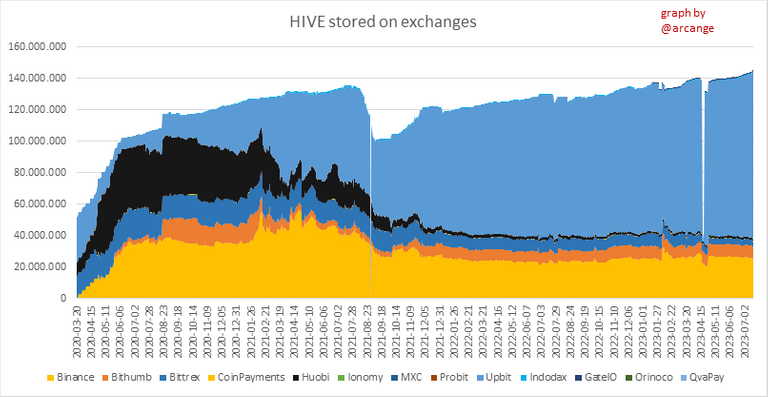 | 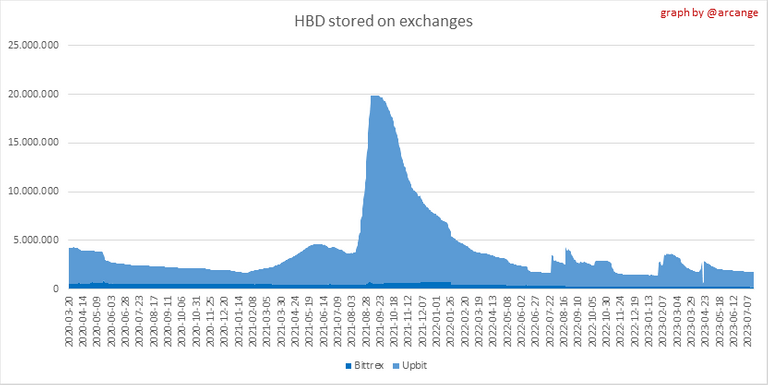 |
These graphs show the daily evolution of HIVE and HBD stored on the exchanges where they are listed.
I hope you find those stats useful. If you would like to see additional stats, feel free to drop me a comment. Your feedback is than welcome.
Thanks for reading.
Check out my apps and services


to go incognito before the eyes of the archangel seems impossible =^^=
🍂🍃👀🍂🍃
!Luv the presentation.
Perhaps you can help me with the HBD savings data.
Only 4% of all HBD is in savings and that is via 16,000 accounts.
That doesn't seem like a lot. I expected higher values.
Also, is a 20% saving high compared to what you can make from trading any given token that can fluctuate by a much greater percentage change?
I don't feel as impressed by the 20% as much as some who think its a non-brainer to accumulate savings.
Any thoughts on saving strategies?
Have a good one.
!ctp
!pizza
!beer
Hello @fjworld, sorry for the late reply
You're right, only a small percentage of HBD is in savings. This might be because many users prefer to keep their HBD liquid for immediate use or trading.
As for the 20% interest, it's indeed an attractive rate compared to many traditional savings accounts. However, as you pointed out, potential gains from trading can sometimes exceed this. It really depends on one's risk tolerance and investment strategy.
In terms of saving strategies, it could be beneficial to diversify - keeping some HBD in savings to earn interest, while also investing in other tokens or assets for potential higher returns. Always remember to do your own research and consider your financial goals and risk tolerance.
Enjoy your day!
!PGM
!MEME
!LOLZ
!FUN
!LUV
!ALIVE
!PIZZA
!BEER
@chillmaw, sorry! You need more $ALIVE staked to use this command.
The minimum requirement is 1000.0 ALIVE staked (non-delegated stake plus incoming delegations).
More $ALIVE is available from Hive-Engine or Tribaldex, plus you can win Alive Power delegations in our daily chat on @alive.chat every day.
@chillmaw, sorry! You need more to stake more $PIZZA to use this command.
The minimum requirement is 20.0 PIZZA staked.
More $PIZZA is available from Hive-Engine or Tribaldex
Credit: azazel5799
Earn Crypto for your Memes @ HiveMe.me!