Hello everyone. I hope you are fine. Cryptocurrencies have been losing value for a few days. Morale is low :) In such cases, the cryptocurrency we need to follow is Bitcoin. Because the first downward or upward intervention by market makers comes in BTC/X parities. Then other cryptocurrencies start to be affected. In this post, we will interpret the BTC/USDT parity. Screenshots were taken from Tradingview site. Data is from Binance exchange. It is always better for analysis to follow the data of exchanges and parities where transaction volume and liquidity are high. The first chart is from the weekly time frame. Let's take a look at the supply-demand regions on the chart.
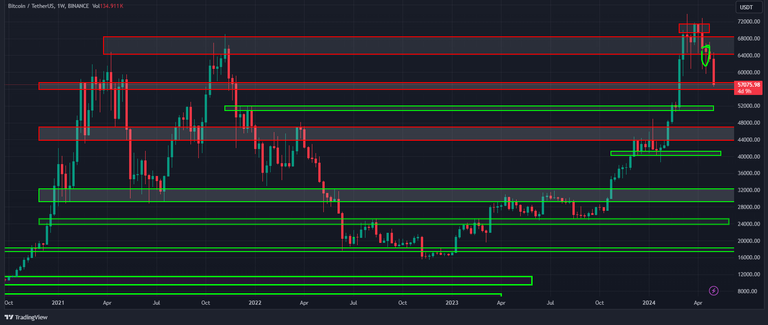
As can be seen from the graph; We are in a price correction phase after a breathless rise. Of course, it is not possible for us to predict how long the price decline will last. However, we can look at price movements. We can observe the levels where the transaction volume decreases and increases. We can detect where the price moves sharply and where it is stuck. Data like this will provide us with a basis in our trading and investment transactions. The second chart is from the daily time frame.
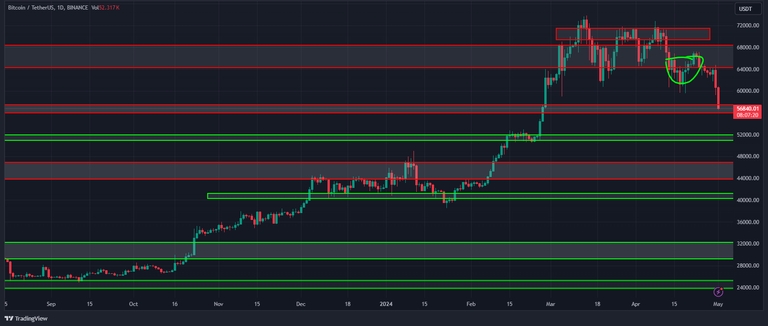
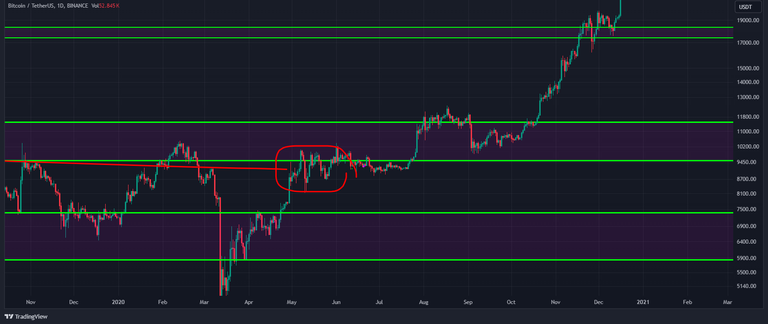
The supply-demand region where the price is located is the price range of 55900-57500. In cases where the price continues to decline, we can follow the 51000-52000 supply-demand region. The wider supply-demand zone below passes through the 44000-47000 price range. I hope it doesn't drop to that level. The supply-demand region above passes through the price range of 64250-68500. For a possible uptrend, Bitcoin price should persist above the 71000-73000 price range. The chart below is the price movements before and after the Bitcoin reward halving on May 11, 2020. As can be seen, the reward halving does not have a positive or negative effect on the Bitcoin price in the short term. As everyone knows, when it comes to the long term, Bitcoin price will continue to rise.
https://peakd.com/hive-167922/@anadolu/bitcoin-chart-analysis-25-december
https://peakd.com/hive-167922/@anadolu/btc-usdt-chart-analysis-january
I have shared a few articles about Bitcoin before. I added links to two of them.
https://peakd.com/hive-170655/@anadolu/hive-usdt-chart-analysis-february
“Are you going to post about Hive?” Questions like these are asked. I do not plan to make new posts unless there is a significant change or price movement. You can access the chart I shared in February 2024 from the link. See you again. Stay tuned.
Posted Using InLeo Alpha
#biTcoin
:) Hive's situation is the same. February 1st $0.3. The price on May 1 is still the same :) 0.3$
Post voted 100% for the hiro.guita project. Keep up the good work.
New manual curation account for BEE and Cent