Aave (Aave)


Market Cap: $5.8 Billion
Daily Chart:
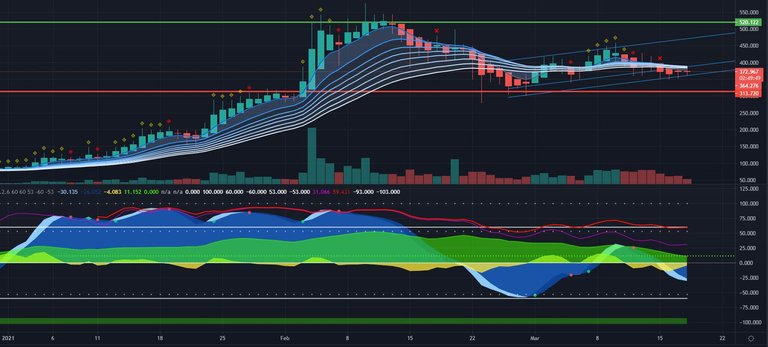
Money Flow: Positive money flow with waning intensity
Momentum Waves: Negative momentum waves with possible divergence
4-Hour Chart:
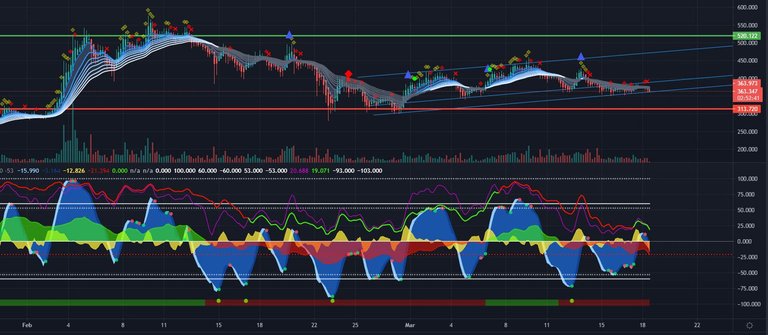
Money Flow: Mostly negative with low intensity
Momentum Waves: Mostly negative with possible divergence
1-Hour Chart:
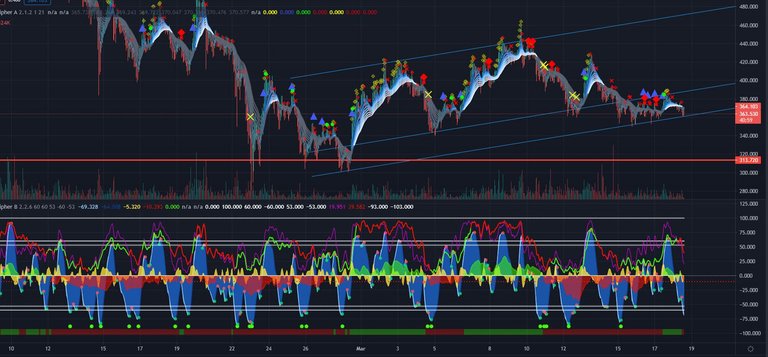
Money Flow: Mostly Negative with mild intensity
Momentum Waves: Mostly negative with waning intensity
Trend Lines, Support & Resistence Levels: Price is currently bouncing in bewtween an upward channel (approximately 10% variation). Potential for medium duration swing trades or long term accumulation. If the price breaks through the current floor expect a decrease of approximately 15%-20% and if the channel is broken to the upside expect a pop of approximately 30%.
Market Cipher Indicators and Outlook: Market Cipher indicators are bearish at the moment with the price well below the recent highs. Even with the bearish indicators the price is in an upward trend and the overall market cap suggests this project has plenty of room to move to the upside into the future.
Indicators by Market Cipher
*None of this is to be taken as financial advise. Do your own research before deciding whether or not to purchase this or any other digital asset.
Posted Using LeoFinance Beta