Your analysis is flawed. STEEM inflation increases when the STEEM price decreases, and decreases when the STEEM price increases (both as a natural consequence of the up-to-1.1x leverage introduced by SBD). Unless you are going to eliminate all STEEM price increases (no thank you), there is no overall "source of inflation" to be used here. It is a source of inflation in declining STEEM price markets but also a sink for inflation during increasing STEEM price markets.
If STEEM increases more than it decreases over time (a nice long term goal, but who knows) then the inflation will end up being lower than the base rate. If it fluctuates more or less equally up and down then it will be more or less unchanged from the base rate.
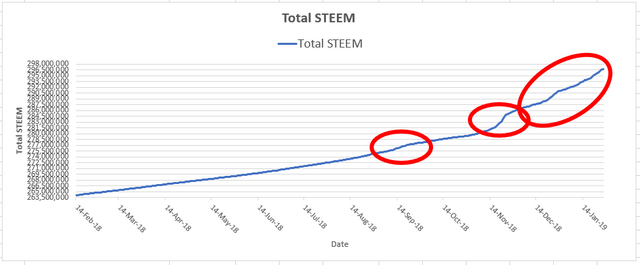
Your post showed a chart of STEEM supply with increases in the inflation rate circled. However, the chart only showed a period of price decline and didn't go far enough back to see major STEEM price increases (late 2017 to early 2018 for one), when the inflation rate would have been reduced. This was incomplete and misleading.
@smooth, I respect you. I must however present the data as factual evidence. Don't take this as a personal attack towards you.
One type of STEEM inflation is set by the following mechanism. This is obtained from the STEEM whitepaper and also verified by my data.
Current inflation rate is 8.57% of the total supply not including the SBD conversions. The SBD conversions has a detrimental and lasting affect on inflation. Which brings me to the other type of inflation.
The other type of inflation is caused by conversion of SBD to STEEM. The debt ratio is somewhat high and we shouldn't be printing STEEM when the conversion is high. This could also pose a potential risk to keep STEEM prices suppressed while SBD is still being printed. This could present a challenge for STEEM price to break past the price of SBD creating somewhat of a feedback loop to continue suppressing the price of STEEM below SBD. (I say somewhat because the price is dominated by market pressure). The detrimental printing also suppresses the price of SBD which is a golden goose for economic stimulant when the price is high (over $1).
To prove that you are wrong about your assertion that my data doesn't go back far enough, I went back and added data as far back as June 28, 2017. Lo-and-behold, this is the new chart. The data doesn't lie. The rate of inflation looks the same all throughout the price roller coaster. If you want, I can go back all the way to HF16, but there is no point. It is still going to look the same.
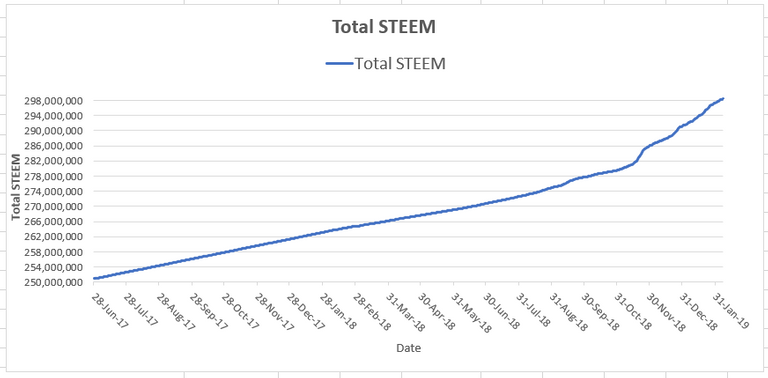
This is the original chart that didn't go that far back
I highly recommend that you find a financial advisor to review the historical STEEM data. Please, we need subject mater experts of economics to weigh in on what is going on.
To put this whole thing in perspective, I am going to leave the community with this statement: You don't flood the economy with money when the economy is bad.
It may not be visible to the naked eye but hold up a straight edge (e.g. piece of paper) to the chart and you can see clearly that the inflation does indeed bend down when the price of STEEM was high and more STEEM was being absorbed into SBD rather than being released from it. For several months fully half of author rewards was not being added to the active supply (it was paid out in SBD instead).
That's the nature of leverage. It works both ways. If you focus on a time period when the entire crypto market is down 90% and STEEM is down 95% then you will see one direction of the leverage effect, but that doesn't mean the other direction does not exist. It surely does.
There is no source of consistent inflation here that can be relied upon to fund budgets.
Again, you are ignoring that conversion of STEEM to SBD (via payouts) and then back to STEEM (via conversions) does not always cause inflation as you claim. It can, and sometimes does, reduce inflation relative to the formula you quoted.
You are missing something important. The golden goose comes from printing. If people do not receive SBD rewards (which is identical to "printing") then they (and the Steem community and stakeholders generally) do not benefit from the overvaluation of SBD. The benefit comes from taking $1 worth of STEEM from the reward pool, printing it as 1 SBD, and then paying out 1 SBD which may be worth $2 if the market is overvaluing it, resulting in $1 worth of "free" aka "golden goose" reward payouts. If you instead pay out STEEM then $1 worth of STEEM from the reward pool generates $1 worth of rewards, instead of $2.
You really need to consult an economic expert.
I'm not saying to stop SBD printing all together. I'm saying return the conservative cut-off to the SBD printing the way it was before HF20. Right now the hair cut is in effect and printing of SBD is reduced to almost nothing. Just recently, the hair-cut temporarily stopped even though the debt ratio was high. This creates too much SBD and soon after causes a conversion of way too much STEEM as the conversion ratio is not 1:1. This creates inflation and pushes us back into hair-cut. It is going to be really difficult to get out of hair-cut. Our economy is going to rely entirely on market pressure to save us just like Steemit Inc relied entirely on market pressure to fund their business. It is not a responsible plan.
I provide you data and you claim that something is wrong with it. If you are not going to believe me no matter what I say, I encourage you to get the data yourself (perhaps from someone you trust like @penguinpablo). Then go to your local college and consult a professor of economics. I'm sure that they would love to entertain an economic discussion. They might even get a student to perform a study on the subject as a project.
I never said there was anything "wrong" with your data. In fact I explained how your data show a reduction in inflation during the period of high STEEM and SBD price (by downward sloping of the supply curve over a period of several months, even if not immediately visible to the naked eye). Your data is fine, your conclusion of SBD conversions as a "source" of inflation is wrong because you ignore SBD printing as a reduction of inflation. In fact you repeat the exact same error in this last reply.
This isn't a question of whether I believe you or not, the mechanism just does not work the way you claim it does.
Finally, the printing cutoff and printing generally has virtually no effect on getting us out of the haircut, or on the debt ratio generally. That's how the numbers work: It takes almost a year to increase the debt ratio by 1% via 100% printing. Close to the 10% cutoff, this is close to the same effect on the debt ratio as a 10% change in the STEEM price, something which happens frequently within one day. Conclusion: Price changes are very nearly the only factor which affect the debt ratio over moderate time periods (days to months), not printing.
Finally, stopping printing SBD means more STEEM paid out as rewards, and likely more STEEM selling pressure as a result. That's possibly counterproductive, but unlikely to ever be any better than a wash in terms of the haircut or debt ratio.