Data Science - Beginning My Journey

Follow along with the code at Posit.cloud or on Github.
I never thought I'd be super interested in Data.
Don't get me wrong, I'm NOT some NPC normie 'sped' who 'doesn't not know nuthin' about them there computers. Not at all. I was using terminals when I was 6, diving into MS-DOS and Win 3.11; I rode the Pentium revolution with multi-threaded applications and a shiny-ass Windows 95 GUI with a START button. Sure I didn't use Linux til my twenties, but that didn't stop me from diving into that technology like any proper autistic millennial did.
So I'm very familiar with technology. I've completely grown up with it, from playing Space Cadet Pinball and Scorched Earth from DOS CLI to creating smart contracts using AI agents() that do my coding bidding, locally. You can't really pry me away from computers or the digital realm. Heck, I've had a HIVE account since before HIVE existed.
Recently I've been doing some coursework (as I fear the next financial downturn might spell the worst for my current employment status) to get some certifications added to the ol' curriculum vitae. Along with finally beginning to learn more than basic bash scripting, AI and web3 have encouraged me to delve into Python.
On a vibe, I started taking some certifications over Data Science & Analytics, specifically the Google Data Analytics Certified Professional. A big inspiration of mine locally in Kansas City is my friend and my brother-from-another-mother Matt Copple. He runs PythonKC and mentored me in python, and we immediately became close as we align on so many things both digitally and with respect to governance. He's into data. Big big big data.

Big Data, Web3 and Me: Where am I going?
Jumping right in, I barreled through the Google Data Analytics Certified Professional course on Coursera and 'learn'd' me some stuff about analytics and data. There was an interesting module in the course, module 7, that I felt really keen on. It was an intro to R Programming.
After going through a brief SQL refresher course, I progressed to the R programming module. Learning R opened a few doors. Now, as a web3 enthusiast, I have a novel target, which is the incorporation of the blockchain data structure into R formatted data (known as Data Frames) and analysis of said data. Sweet. This is something that feels novel enough, yet open for exploration. This feels perfect to start the journey into data.
Eventually I want to do data science and analysis full time, or at least have it incorporated into my toolset when I transition to web3. My future goals is operating within the new web3 and web0 internet architectures, divorcing myself of traditional financial systemic oligopoly. It it freedom and web3, data and AI for all, or bust for me. Refuse all alternatives, fight the centralized, freedom for all.

I really took to R Programming
There is just something about using arrow operator notation is super <- freaking cool lol. I'ma goober I suppose, but R is kinda fun to program in. We could say R <- "Fun to code in"
It isn't as awesome as python is, but for what R designed and intended for, it works. R is for Data Science and Analytics. Don't try to use R for other stuff because python can do it better. But if you want some serious data analytics and data science done at performative speeds, R is the way to go.
It uses a funky syntax when it comes to equation operators, electing to use arrow notation (i <- 69) opposed to equals notation (i = 69). However both operators work. I think this is call-out from the R community demanding their validity apart from python personally, but, who am I lol. That said, I like the minimal way it hands things. As a novice dev, python can get layered very quickly; R feels like it tampers that down and manages it so it can complete task at hand: data science.

An R Capstone Project
So to complete the course, Coursera requested that I complete a capstone project. While this was optional, I still elected to test my hand at incorporating R programming with blockchain technology. Clearly Ethereum was the first choice as it has been API'd to Hell n back. I went with an API service called Blockspan because it was both free, and they already had prebuild R modules to tap into.
Building out a system that does Data Analytics and Data Visualization is what I decided to do. I used a service called Posit.cloud which is an online development cloud kernal service that runs several different kernals, including python, but is known for its incorporation with R programming. I built the project in a R markdown structure (*.rmd), that is to say, anyone can run this just like running code chunks within Juypter notebooks or other notebook services.
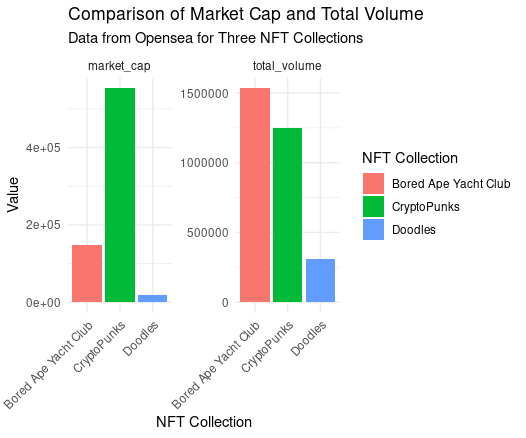
The end result from running this project. Using ggplot2() from tidyverse.
You can find the Blockspan R project both here on Posit.cloud or here on Github. In order to run the project you must get a free key from Blockscan which is how you will be accessing the Ethereum blockchain.
This code is documented in a way that a user can understand how the data is getting accessed, parsed, and turned into something usable. The end result of the process will generate a graph showing stats from 3 well known NFT collections on the blockchain, Doodles, Cryptopunks and Bored Ape Yacht Club. You can change out the contract address within the code to parse other collection data.

Congratulations @amphlux! You have completed the following achievement on the Hive blockchain And have been rewarded with New badge(s)
Your next target is to reach 60000 upvotes.
You can view your badges on your board and compare yourself to others in the Ranking
If you no longer want to receive notifications, reply to this comment with the word
STOPCheck out our last posts: