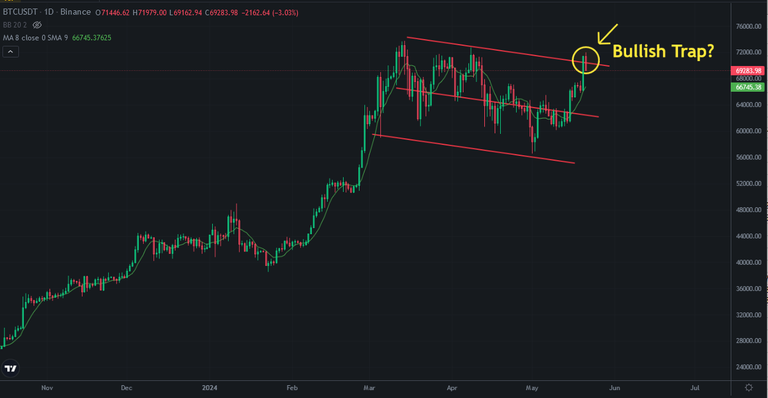
Bitcoin price broke up descending channel yesterday. Even Bitcoin price touched 72K, It could not break up this resistance and did not touch new all time high..
After price pump and break up the resistance, Bitcoin price went down into descensing channel again. So, it may be a bullish trap during price correction.
Bitcoin has entered midterm price correction before after halving. It may be early to see new all time high again. Because, price correction may be not be ended.
Here you can see daily cahrt of Bitcoin. Even downtrend resistance is broken up, Bitcoin price went down this resistance. It did not work as a support line. This is not a retest before bull run.
Here you can see the indicators on Bitcoin price chart. I shared this bowl pattern on RSI Indicator yesterday. We will see breaking down in this Indicator until end of July. So, we will see new price dump pn market until this time.
It may be early to enter mega bullish altcoin season now.
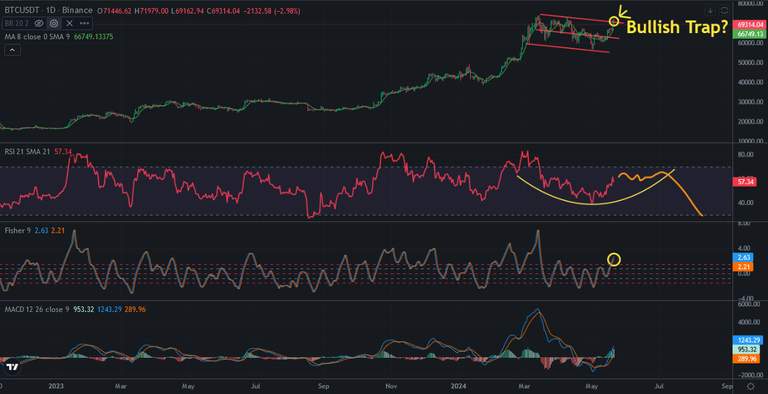
So, we should be careful for bullish traps. It seems as a bullish trap on Bitcoin price chart.
We will see if it is a trap in a few days.
Posted Using InLeo Alpha
This post has been manually curated by @bhattg from Indiaunited community. Join us on our Discord Server.
Do you know that you can earn a passive income by delegating your Leo power to @india-leo account? We share 100 % of the curation rewards with the delegators.
100% of the rewards from this comment goes to the curator for their manual curation efforts. Please encourage the curator @bhattg by upvoting this comment and support the community by voting the posts made by @indiaunited.