
Welcome to the daily financial report about the Hive blockchain.
All the information presented in this report is based on the data collected from the blockchain until 2023-02-28 midnight UTC. This report aims to provide you with a clear view of what is happening on the Hive blockchain.
 Este post está traducido al español - aquí
 Dieser Beitrag ist ins Deutsche übersetzt - hier
 Une version en français de ce post est disponible - ici
1. Price
 |  |
These graphs show the evolution of prices in USD for HIVE and HBD.
2. Supply

This graph shows the evolution of HIVE virtual Supply. The virtual supply is the sum of HIVE supply (liquid and staked HIVE) and HBD supply (converted into HIVE).
The graph also displays the debt ratio (HBD supply / HIVE virtual supply). Keep in mind that since hardfork 24 funds in the treasury (@hive.fund HBD balance) don't count towards the HBD debt ratio.
 |  |
These graphs show the evolution of the HIVE Supply (both liquid and staked) and the HBD supply.
 | 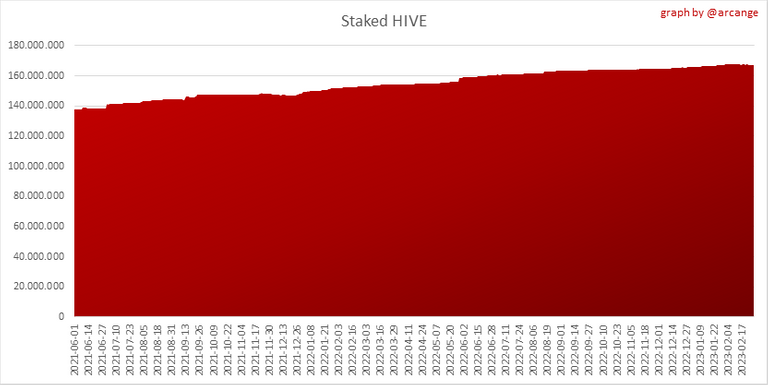 |
These charts show the evolution of the liquid HIVE and the staked HIVE (Hive Power).
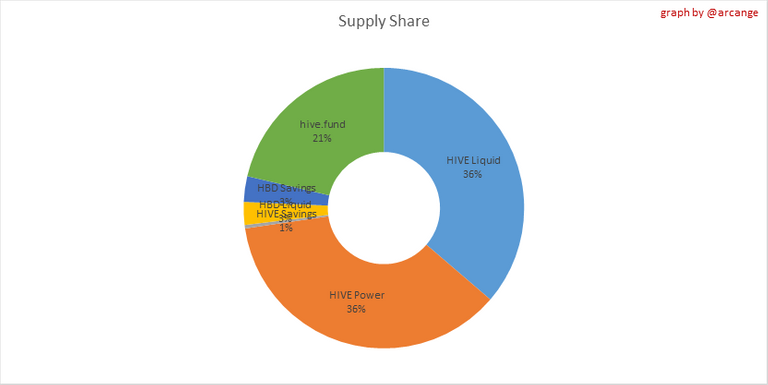
This graph shows the overall Hive tokens distribution.
3. HBD Savings
| Account | Deposit | Account | Withdrawal |
|---|---|---|---|
| @cbjinvest | 707.170 HBD | @cloudblade | 16,880.953 HBD |
| @hive.one | 593.111 HBD | @j1984 | 15,396.608 HBD |
| @odies | 511.809 HBD | @muenchen | 5,000.000 HBD |
| @watchlist | 415.012 HBD | @nftshowroombank | 1,000.000 HBD |
| @v4vapp.tre | 300.000 HBD | @incentic | 746.516 HBD |
| @deanliu | 243.872 HBD | @demotruk | 500.000 HBD |
| @adamada.stem | 200.000 HBD | @calimeatwagon | 370.000 HBD |
| @l337m45732 | 186.976 HBD | @thevenusproject | 290.000 HBD |
| @ophibious | 153.089 HBD | @shaidon | 100.000 HBD |
| @offgridlife | 114.256 HBD | @janetedita | 100.000 HBD |
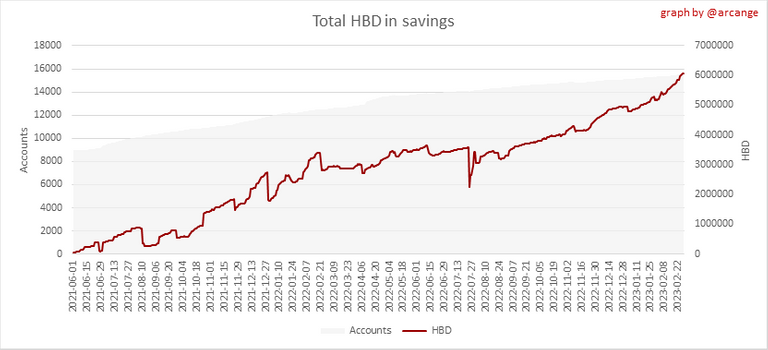
This graph shows how much and how many accounts store HBD in savings. The table below shows the topmost HBD deposits and withdrawals of the day.
Note: As of 2021-06-30 (HF25) interest is only paid for HBD which are stored in savings.
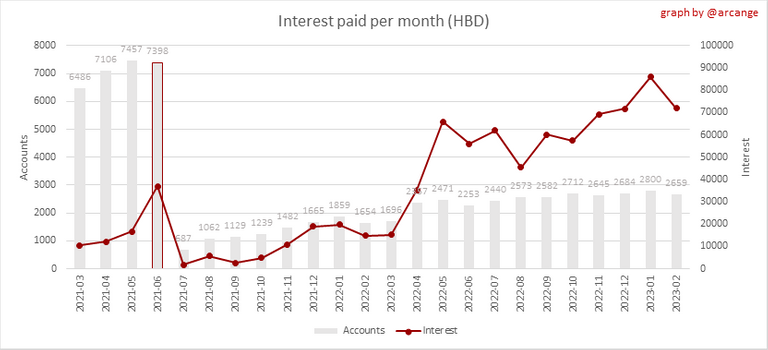
This chart shows the amount of interest paid each month for holding HBD and how many accounts received such interest.
4. Balances

This graph shows the number of HIVE, both liquid and in savings, held by all accounts.

This graph shows the number of HBD, both liquid and in savings, held by all accounts.
5. Conversions
Note: As a reminder, conversion requests are only finalized after 3 days. It is only then that it is known exactly how many HIVE were burned in return for the HBD received at the time of the conversion request.

This graph shows the number of HIVE collateralized due to requests to convert HIVE to HBD over the past few days.
 |  |
These graphs show the number of HIVE effectively used by the conversion process (HIVE converted and 5% HIVE fee which is burned) each day and month when requests to convert HIVE to HBD have been finalized.
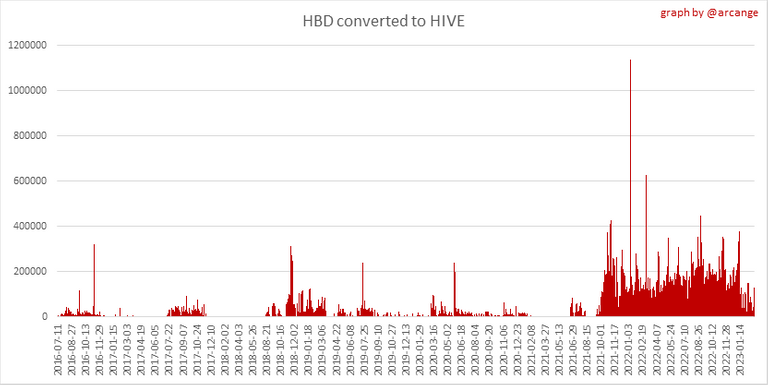 | 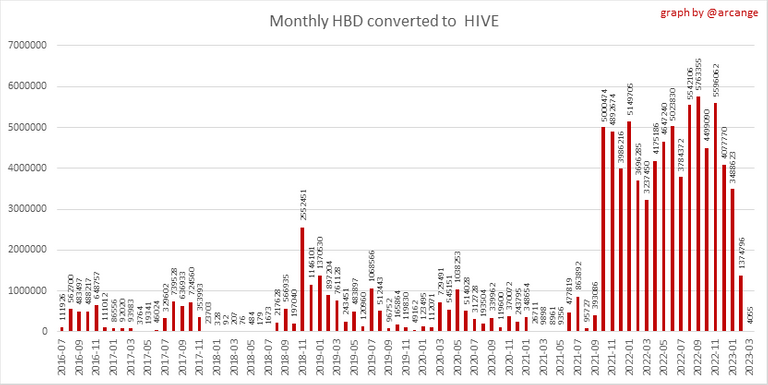 |
These graphs show the number of HBD burned, each day and each month, following requests to convert HBD to HIVE.
6. Powerup and Powerdown
| Date | Account | Amount |
|---|---|---|
| 2023-02-28 01:10:18 | @bdvoter | 55,052.277 HIVE |
| 2023-02-28 03:42:36 | @tobetada | 26,000.954 HIVE |
| 2023-02-28 08:38:54 | @kencode | 20,000.414 HIVE |
| 2023-02-28 01:24:48 | @pharesim | 17,344.766 HIVE |
| 2023-02-28 05:27:00 | @chorock | 13,000.404 HIVE |
| 2023-02-28 04:21:24 | @steemaccess | 10,480.565 HIVE |
| 2023-02-28 07:18:39 | @samgiset | 9,786.791 HIVE |
| 2023-02-28 09:06:24 | @diodao | 1,553.815 HIVE |
| 2023-02-28 06:49:33 | @break-out-trader | 1,351.036 HIVE |
| 2023-02-28 06:18:12 | @marcocasario | 1,027.325 HIVE |
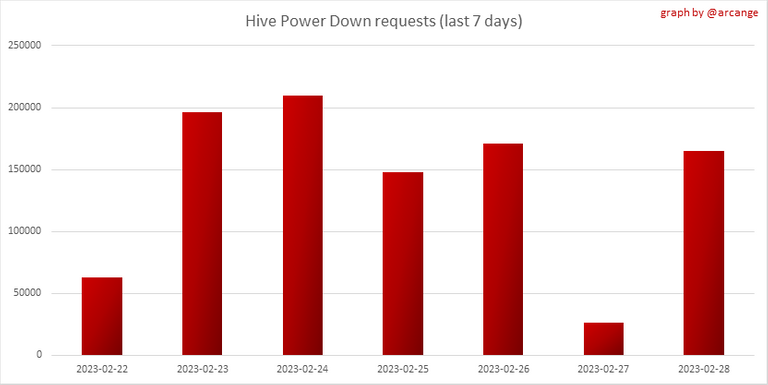
This graph and table show the amount of powerdown initiated over the last 7 days, and the largest initiated on this day.

| Account | Powerup | Account | Powerdown |
|---|---|---|---|
| @dcrops | 3,585.998 HIVE | @appreciator | 20,021.796 HIVE |
| @deanliu | 1,000.000 HIVE | @bnb-hive | 5,179.489 HIVE |
| @bflanagin | 1,000.000 HIVE | @bdvoter | 4,175.236 HIVE |
| @gogreenbuddy | 837.141 HIVE | @leo.voter | 3,644.063 HIVE |
| @ecoinstats | 520.000 HIVE | @methodofmad | 2,083.799 HIVE |
| @niallon11 | 500.000 HIVE | @kendewitt | 1,412.642 HIVE |
| @steembasicincome | 498.756 HIVE | @intothewild | 1,227.541 HIVE |
| @aljif7 | 464.525 HIVE | @wagginston | 1,157.669 HIVE |
| @buggedout | 265.000 HIVE | @denmarkguy | 1,119.731 HIVE |
| @misterc | 154.000 HIVE | @mr-altilis | 863.205 HIVE |
This graph shows the daily HIVE power-up, power-down, and the resulting variation over the last 30 days. The table shows the topmost power-ups and power-downs of the day.

This graph shows the monthly HIVE power-up, power-down and the resulting variation.
Values for the last 3 months
| Period | Powerup | Powerdown | Difference |
|---|---|---|---|
| 2023-02 | 606,221.000 | 2,537,169.000 | -1,930,948.000 |
| 2023-01 | 1,360,922.000 | 1,914,402.000 | -553,480.000 |
| 2022-12 | 1,346,918.000 | 2,312,701.000 | -965,783.000 |
7. Transfers
These graphs show the volume (in USD) of HIVE and HBD transferred between accounts.
8. Exchanges
 | 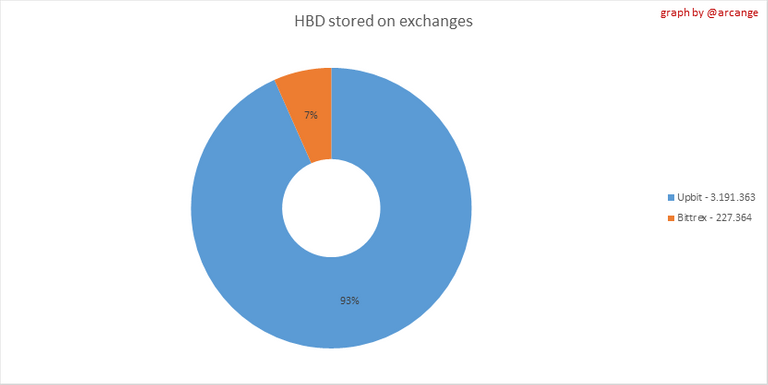 |
These graphs show the amount and distribution of HIVE and HBD stored on the exchanges where they are listed.
 | 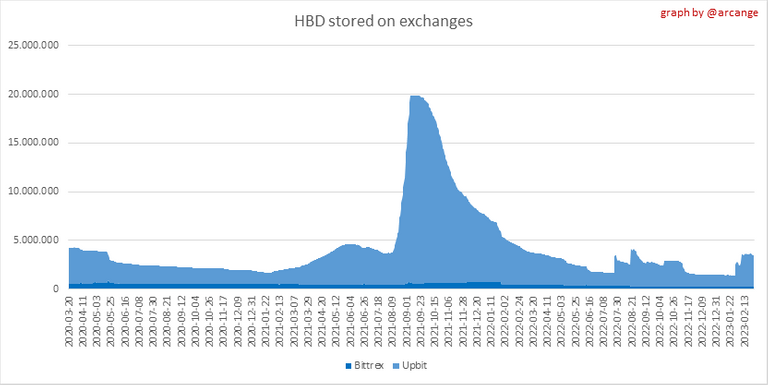 |
These graphs show the daily evolution of HIVE and HBD stored on the exchanges where they are listed.
I hope you find those stats useful. If you would like to see additional stats, feel free to drop me a comment. Your feedback is than welcome.
Thanks for reading.
Check out my apps and services


Cool report. First time I have seen this. Thanks.
You're welcome! I'm glad you found the report interesting.
Yes it is helpful to get a better idea of what is going on.
Greetings from An Man Bot! The Bot that loves An Man
trippy heart.
BTW, I noticed I miss your witness vote 😢
Do you mind casting one to me? It would be much appreciated!
I noticed I missed a vote on my posts or comments. We are both sad for not getting votes.
I am not too familiar with your projects but will add it to a list of topics to read up on. There is a lot to read and learn on the chain and witness vote is a large topic I do not want to vote blind.
!BEER
Greetings from An Man Bot! The Bot that loves An Man
What is your name...what should my bot be called to show love to you? The Botthatlovesthebotthatlovesan-man..... too long...
View or trade
BEER.Hey @arcange, here is a little bit of
BEERfrom @an-man for you. Enjoy it!We love your support by voting @detlev.witness on HIVE .
PIZZA Holders sent $PIZZA tips in this post's comments:
@pixresteemer(2/5) tipped @arcange (x1)
Join us in Discord!
Hello @arcange, can you tell me how to get HPUD? because I don't have a mentor to tell me, please don't laugh at me😅
You can read this post: https://peakd.com/hive-122221/@hivebuzz/pud-202303
Thanks for your information @arcange
You're welcome @umirais
Congratulations @arcange! You received a personal badge!
Wait until the end of Power Up Day to find out the size of your Power-Bee.
May the Hive Power be with you!
You can view your badges on your board and compare yourself to others in the Ranking
Check out our last posts:
Congratulations @arcange! You received a personal badge!
Participate in the next Power Up Day and try to power-up more HIVE to get a bigger Power-Bee.
May the Hive Power be with you!
You can view your badges on your board and compare yourself to others in the Ranking
Check out our last posts:
Geez, that powerdown differential for February is not good. Would have thought we'd be close to turning positive there by now...
Yes, the powerdown differential for February is not ideal. However, we have to keep in mind that there are many factors that can influence this metric. Let's hope for a better result in the coming months!