I had made a very philosophical post about justifying steem inflation back in 2018 - Steem Inflation : A Tool for Efficient Creation and Effective Redistribution of Wealth. The post was made on 5th March 2018. That time the steem inflation was 4.88%. When I look back I was right in justifying that much inflation.
But a lot has changed over last one year and since then the inflation has been going up and up. Below figure shows the entire inflation profile of Steem with its price.
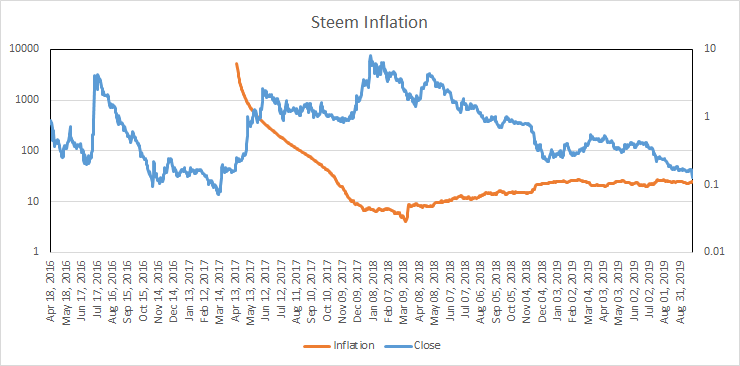
For visibility I used log scale. The Starting inflation was very high >5000%. Then it started reducing all the way to 4% by 12th March 2018. And the result of that was the price of the steem kept increasing as a result of that plus overall bull run of crypto market.
And since 12 March 2018 the inflation has been rising with current value of 24%. The result of that is that the price is going down which is further accelerated by bear phase.
There is no denying the fact that current steem inflation is much higher than planned and it is happening for more than a year. The unfortunate part is no one is taking note of it so that it can be corrected.
According to my inflation philosophy described in above article - this inflation is bad and not sustainable. Our target should be less somewhere between 2-5% as the case is for BTC and ETH.
How do you define Steem inflation? The article you linked to has no calculations.
I ask because now is, indeed, about 24%, even higher actually, but it wasn't 4.88% back in March 2018.
Pls take the data from cmc. Compute supply by dividing market cap with price. Then do computations for 1 year percent change and that is your inflation.