Ripple Price Technical Analysis – XRP/USD Tumbles Further
Key Highlights
Ripple price could not hold the $0.9000 support and moved below the $0.8400 level against the US dollar.
There is a key bearish trend line forming with resistance at $0.8700 on the hourly chart of the XRP/USD paid.
The pair is trading around the $0.8400 level and is currently trading with a bearish bias.
Ripple price failed to move higher and declined against the US Dollar and Bitcoin. XRP/USD may correct a few points higher, but it could face resistance near $0.9000.
Ripple Price Upside Hurdle
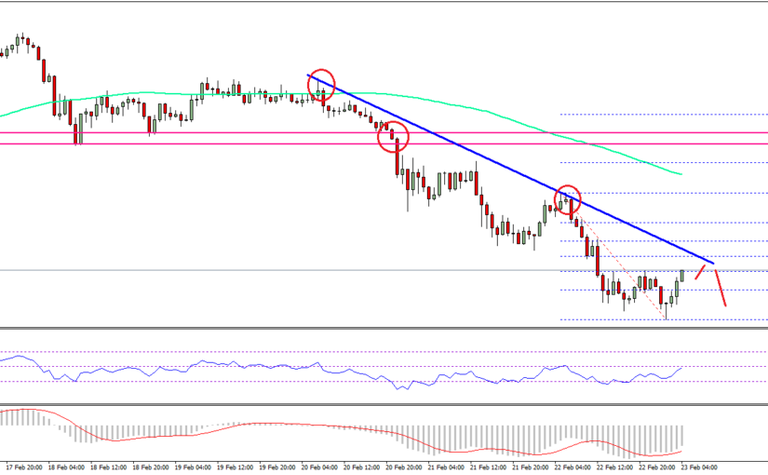
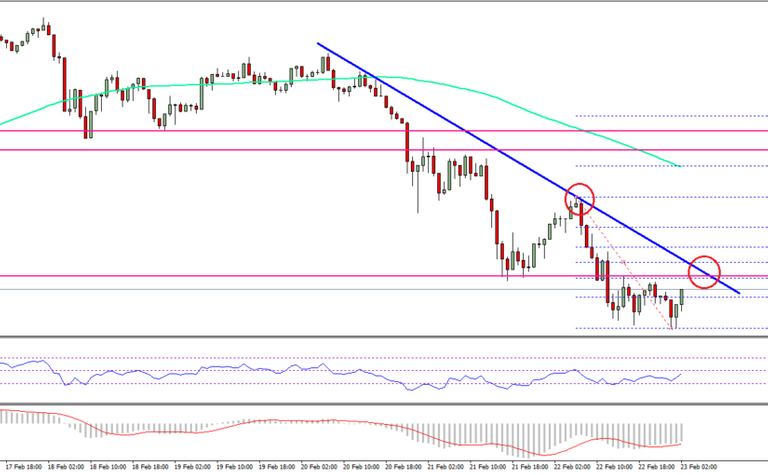
There was an extension to yesterday’s decline in Ripple price from the $0.8800 swing high against the US Dollar. The price failed to hold the $0.9000 and $0.8400 support levels and declined further. An intraday low was formed at $0.8015 before price started a minor upside correction. It is currently trading above the 23.6% Fib retracement level of the last decline from the $0.9483 high to $0.8015 low.
However, there are many hurdles on the upside below the $0.9000 level. There is also a key bearish trend line forming with resistance at $0.8700 on the hourly chart of the XRP/USD pair. At the moment, the price is testing the 38.2% Fib retracement level of the last decline from the $0.9483 high to $0.8015 low. There is a chance of it moving further higher towards the $0.8700 or $0.8800 levels, but an upside break won’t be easy. Moreover, the 50% Fib retracement level of the last decline from the $0.9483 high to $0.8015 low is at $0.8749 to act as a resistance.
Ripple Price Technical Analysis XRP USD
On the downside, the $0.8100 and $0.8000 levels are decent supports. As long as the price is above the $0.8000 handle, it could make an attempt to recover above $0.9000.
Looking at the technical indicators:
Hourly MACD – The MACD for XRP/USD is slowly reducing its bearish slope.
Hourly RSI (Relative Strength Index) – The RSI for XRP/USD is currently moving higher towards the 50 level.
Major Support Level – $0.8000
Major Resistance Level – $0.9000
__
Altcoin Analysis: NEO, EOS, LTC, DASH and Lumens

Bears all over guys and so far, all altcoin gains from last week’s bullish run has been reversed. LTC, EOS, NEO, Lumens and even DASH are on a down trend testing last week’s lows.
Let’s have a look at these charts:
XLM/USD

Lumens Technical Analysis
XLM/USD Daily Chart for February 23, 2018
So far, Lumens sellers are trending right at last week’s lows and that’s a 100% retracement as far as price action is concerned.
Now, the thing is this week has been largely bearish-we can see that and track from what has been happening over the past couple of days.
If we zoom into the 4HR chart we notice that bear momentum is waning as candlestick are beginning to print away from the lower BB with stochastics at over sold territory.
This doesn’t mean much and isn’t our basis for going long or short but should be hinting especially now that we are looking for buy signal.
If any bullish engulfing candlestick prints and drive prices above $0.38, then I recommend longs if not and prices close below $0.30 today, then we better look for sell opportunities because that will be a bear break out below this ascending wedge.
DASH/USD

DASH/USD Technical Analysis
DASH/USD Daily Chart for February 23, 2018
Like the Lumens, DASH is on a down trend and if we view price developments in the 4HR chart then we notice that sellers are actually stepping on gas as they band along the lower BB.
In the daily chart however, we are at a cross road and wont recommend buy or sell unless there is a definitive follow through of yesterday’s bear pressure.
Remember, from previous analysis the middle BB and price around $620 remains a key price tag since it is right at previous bullish break out point and we are yet to know if this will turn out to be a retest or bear resumption despite last week’s bullish pressure.
In my view, buyers need prices to pick up and if there is a close above $620, then that would be a double bar reversal pattern or a retest right at the middle BB.
EOS/USD

EOS/USD Technical Analysis
EOS/USD Daily Chart for February 23, 2018
Because of yesterday’s bear confirmation, we remain neutral for the time being until we see what happens to EOS value at around $6 and $7.
Those are 2018 lows and should definitely influence prices in the short term.
The middle BB will continue being our first layer of resistance with $9.5 being our bull trigger assuming there is a strong reaction at $7 in the coming sessions.
LTC/USD

LTC/USD Technical Analysis
LTC/USD Daily Chart for February 23, 2018
From the chart, sellers are definitely in charge and as long as yesterday’s LTC bear pressure continue, then chances of the middle BB and $160 being hit is high.
Our strategy is on course and what remains today is if there will be a reaction at $180. If prices slow down and any bullish engulfing candlestick prints anywhere around support in the 4HR chart, then bulls can buy and spread out their entries.
Otherwise any surge past $160 will invalidate our initial bullish break out strategy.
NEO/USD

NEO/USD Technical Analysis
NEO/USD Daily Chart for February 23, 2018
Guys, all we can say is NEO is continuing with the shed. So far, $10 is off from yesterday’s lows and as long as bears continue with the swing, then chances are they shall test the break out line at $100 before a possible trend resumption happens.
All charts courtesy of Trading View
Asian Altcoin Trading Roundup: Top Cryptocurrency is DigixDAO

The selloff continues as the week ends in crypto land. Asians are leading the way and dropping their digital currencies for the third day in a row. Bitcoin has lost 8% on the day and has dropped back to just over $10k, altcoins as usual have been hit harder and are all in the red during this morning’s Asian trading session.
We have to go a long way out of the top 25 to find one that is actually up on the day. The only one in the top slot that is even in the green is Nano which we featured yesterday. Still trading higher on news of the app release, Nano is up 3.8% on the day – every other altcoin has fallen.
The next cryptocurrency that is up is DigixDAO, the gold based crypto that seems to do well when all others are falling. DGD is up 4.2% on the day, trading at $318 at the time of writing and has had a very good week gaining 34% from $235 this time last week. The only major difference with this coin is that it is based on a commodity which is why it seems to weather the storms better when all others are plummeting.

There are only 2 million DGD tokens circulating, most of which are traded on Binance which has almost 90% of the total. Market capacity currently stands at $635 million and it is ranked at number 35. $77.5 million has been traded in DGD over the past 24 hours.
All other altcoins are in the red but ones that have not taken such a hit include Ethereum, Neo, Bitcoin Gold, Rchain, and Maker. There are some bargains out there for those that like to buy the dip however the dip could keep dipping throughout the day.
Ethereum Price Technical Analysis – ETH/USD Decline Looks Real
Key Highlights
ETH price faced a lot of selling pressure recently and declined below $810 against the US Dollar.
Yesterday’s highlighted major bearish trend line with current resistance at $820 is intact on the hourly chart of ETH/USD .
The pair may correct a few points in the short term, but it remains in a downtrend below $840.
Ethereum price extended losses against the US Dollar and Bitcoin. ETH/USD declined as low as $776 and it is currently correcting higher toward barriers.
Ethereum Price Resistance
There was no major upside move in ETH price above the $860 level against the US Dollar. The price struggled to correct higher and it started a downside move below the $840 level. It declined and broke a couple of support levels such as $810 and $800. It traded as low as $776 from where a minor upside correction was initiated. However, the price may face many barriers on the upside on the way to $810.
It has moved above the 23.6% Fib retracement level of the last decline from the $858 high to $776 low. However, there is a major resistance near $810-820. More importantly, yesterday’s highlighted major bearish trend line with current resistance at $820 is intact on the hourly chart of ETH/USD. The trend line resistance is close to the 50% Fib retracement level of the last decline from the $858 high to $776 low. Therefore, if the price corrects further from the current levels, it could face sellers near the $820 and $825 levels. Above $825, the next major barrier for buyers is at $840.
Ethereum Price Technical Analysis ETH USD
On the downside, the recent low at $776 is a key intraday support. If the price fails to stay above $776, then it could accelerate declines towards the $750 level.
Hourly MACD – The MACD is gaining pace in the bearish zone.
Hourly RSI – The RSI is correcting higher, but with no major bullish sign.
Major Support Level – $776
Major Resistance Level – $825
Bitcoin Cash Price Technical Analysis – BCH/USD Breaks $1,200

Key Points
Bitcoin cash price did not correct higher and declined below the $1,200 support against the US Dollar.
There are two bearish trend lines forming with resistance at $1,250 and $1,280 on the hourly chart of BCH/USD.
The pair may decline more in the near term and it could even break the $1,100 support level.
Bitcoin cash price declined further below $1,200 against the US Dollar. BCH/USD looks set to extend the current decline towards or below $1,100.
Bitcoin Cash Price Resistance
There was no stopping sellers as bitcoin cash price failed to correction above the $1,300 level against the US Dollar. The price declined and broke yesterday’s low to trade below the $1,200 level. It opened the doors for more losses and the price traded towards $1,150. A low was formed at $1,134 and it seems like the price is struggling to correct higher in the short term.
On the upside, the price is facing resistance near the 23.6% Fib retracement level of the last drop from the $1,325 high to $1,134 low. There are many resistances on the upside below the $1,300 level. More importantly, there are two bearish trend lines forming with resistance at $1,250 and $1,280 on the hourly chart of BCH/USD. The first bearish trend line is close to the 50% Fib retracement level of the last drop from the $1,325 high to $1,134 low. Therefore, a break above the $1,250 and $1,260 levels won’t be easy. Above $1,260, the second trend line at $1,280 is the next hurdle.
Bitcoin Cash Price Technical Analysis BCH USD
On the downside, the recent low of $1,134 is a short-term support. If the price breaks the stated level, it could test the $1,100 level.
Looking at the technical indicators:
Hourly MACD – The MACD for BCH/USD is placed nicely in the bearish zone.
Hourly RSI (Relative Strength Index) – The RSI for BCH/USD is currently near the oversold levels.
Major Support Level – $1,100
Major Resistance Level – $1,250
__
Bitcoin Price Technical Analysis for 02/23/2018 – Short-Term Reversal Signal

Bitcoin Price Key Highlights
Bitcoin price recently formed a head and shoulders pattern on its 1-hour chart.
Price has broken below the neckline to show that a downtrend is underway.
The chart pattern spans more than $1,000 in height so the resulting selloff could be of the same size.
Bitcoin price broke below a short-term head and shoulders pattern to signal that more losses are in the cards.
Technical Indicators Signals
The 100 SMA is above the longer-term 200 SMA to show that the path of least resistance is to the upside or that the rally could continue. However, the gap between the moving averages has narrowed to show that bearish momentum could kick in.
Stochastic is hovering around oversold levels and could turn higher to show that buyers are ready to get back in. RSI is also in the oversold area, which means that sellers are exhausted.
In that case, a pullback to the broken neckline around $10,250 could happen before selling pressure gains more traction.
Market Factors
The US dollar gave up ground to most of its peers in recent trading sessions as risk appetite picked up. However, bitcoin price failed to benefit from this as profit-taking is being blamed for the recent drop.
Zooming out to the longer-term charts shows that price hit a long-term area of interest at $12,000, which prompted some liquidation orders. This marked the second straight day of declines for bitcoin as positive sentiment over the recent regulatory news appears to be fading.
With that, bitcoin price could need a fresh positive catalyst before resuming its rally. Otherwise, it could revisit the lows closer to the $6,500 level as more and more officials are expressing their doubts about the cryptocurrency.
Apart from that, the SEC charged former cryptocurrency exchange BitFunder and its founder Jon E. Montroll with fraud for running the operation as an “unregistered securities exchange” and allegedly defrauded clients.
source
#xrp #neo #eos #ltc #dash #xlm #digixdao #eth #bch #btc #steem #sreemit # analysis #technical trending #new #hot #prometed @a-blockchain
Good analysis ;) keep it up!

Thanks Dear @cryptoforexhunt