
BTC/USD
BTC/USD is being traded at $6,544 and continues to move sideways in a narrow range. Formed flat against the background of minimum volatility promises to drag on until the end of the month, exhausting market participants with small swings. But nevertheless, volumes are beginning to be collected, which allows us to consider the situation from a global perspective. It is worth remembering that recent price peaks owe their appearance to Tether. But after the collapse with this stablecoin, there was a redistribution of assets, and now investors are gaining ground again. Probably growth will occur, but certainly from lower and more promising levels. Therefore, in the near future, it is worth waiting for the decline, and it is likely that this will not last for a day or two.
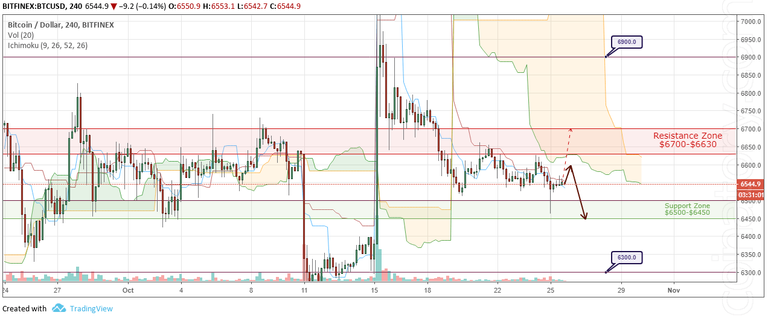
BTC/USD Forecast and analytics 26 October 2018
As part of the forecast for October 26, we can expect the continuation of price fluctuations in a very narrow range. Currently, a more likely scenario would be a decline to $6,500 - $6,450 for testing support. In case of a sharp drop below $6,200, a further decline to $5,900 is likely.
Cancellation of the development of the downward movement will be a pulsed growth and the breakdown of the resistance level at $6,700. In the case of consolidation above, growth is likely to $6,800, then - to $7,150.
ETH/USD
ETH/USD is being traded at $204.64 and continues to decline as part of a downward channel of H4 level. Yesterday's trading day did not show significant market changes. The price did not reach the indicated range of $202.00 - $202.50 and slightly pushed off from $202.90. Such a small upward correction does not significantly affect further expectations of a decrease in quotations.
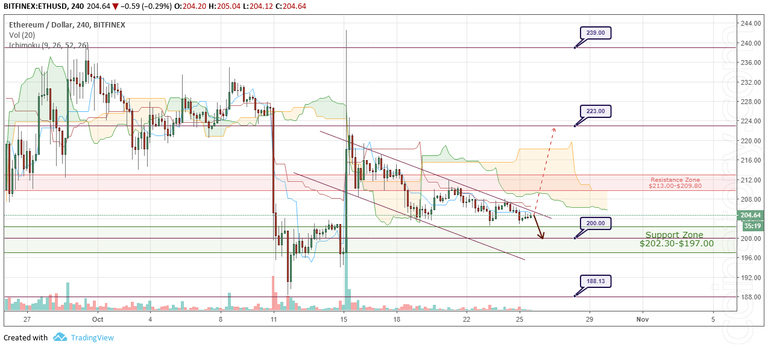
ETH/USD Forecast and analytics 26 October 2018
As part of the forecast for October 26, we can expect a downward movement to continue deep into the support zone, to the level of $200.00. We should not forget that when it comes to the close proximity of prices to any levels and borders of channels, one can never rule out attempts at the false breakdown. For this reason, it is possible that the price may test the area of the signal lines of the Ichimoku Kinko Hyo cloud at $206.36 before going down.
The abolition of the reduction option will be an impulse growth, with the price fixing above the resistance zone. This will allow us to expect further growth to $223.00.
XRP/USD
XRP/USD is being traded at $0.46817 and continues to trade in correction. If today's trading day does not bring new news and rumours, it is likely that the coin will leave for the weekend being squeezed within the boundaries of the current trading corridor $0.47500 - $0.46000. In any case, the boundaries of the flat are somewhat wider, and in order for a directional movement to occur, the price will first have to cope with one of them.
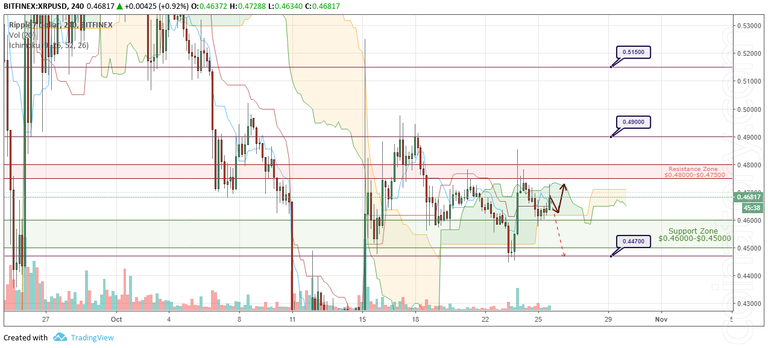
XRP/USD Forecast and analytics 26 October 2018
As part of the forecast for October 26, we can expect that the coin will continue to be traded within the boundaries of the Ichimoku Kinko Hyo cloud, which are not very different from the boundaries of the support and resistance areas. After the breakdown of one of them, it will be possible to build further predictions. But given the positive news background, the priority direction of further movement is upward.
Cancellation of the development of the correction with the priority to further growth will be a downward impulse, in order to return to the previous price values of $0.44700.
XMR/USD
XMR/USD is being traded at $107.320 and continues to decline as part of the current flat. At the moment, there is almost no doubt that the coin is being traded as part of a wide correctional flat of $112.000 - $105.000, which arose after the rapid growth at the beginning of last week. Today's trading day can show the final confirmation of this, if we see the price at around $106.700. Forecasts in the medium term can be made after the breakdown of one of its borders. You can also note a very small trading volume, compared with even the previous month. This is an alarm signal indicating that the flat stage can be very prolonged.
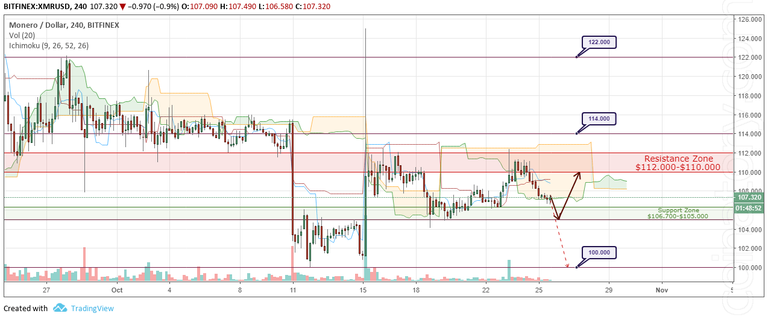
XMR/USD Forecast and analytics 26 October 2018
As part of the forecast for October 26, we can expect the continuation of a corrective pullback down to the lower flat bound of $105.000. I would like to believe that at this level there will still be support in the market and the price is pushed from it to rush to the upper limits of $112.000 - $110.000.
Cancellation of this option will be the breakdown of the price of the lower level of the flat and the fall to $100.000. The reason for such a fall could be the lack of a sufficient number of participants in the market and a negative informational background.
Posted from my blog with SteemPress : https://coinatory.com/2018/10/26/cryptocurrency-prices-analysis-and-forecast-26-october-2018/
Very interesting... Good work !
we've got such things coming out daily, except of sundays