In the anti-virus reverse debugging, it is necessary to understand the anti-debugging and anti-debugging,Looking at a lot of information found that there are principles, there are plug-in, but not plug-in to do anti-debugging. WinDbg forum inside the information is also very poor. And that's where this article came in.
Basic knowledge required in this article.
(1) be able to tap Win32 programming code.
(2) understand TEB and PEB.
TEB(Thread Environment Block):The system stores the thread related data frequently used in this TEB. It is located in the user address space. Each thread in the process has its own TEB. All TEB of a process is stored in a stack of linear memory that starts from 0x7FFDE000 (WinXP, of course, different systems may be located at different addresses), and each 4KB is a complete TEB, but the memory area is extended down. In user mode, the TEB of the current thread is located in an independent 4KB segment, which can be accessed through the FS register of CPU, which is usually stored in [FS:0]. In user mode, the TEB address can be obtained from command $thread in WinDbg.
PEB(Process Environment Block):Store process information, each process has its own PEB information. It is located in the user address space. At Win XP, the address of the process environment block is fixed for each process, and at 0x7FFDF000, this is the user address space, so the program can access it directly.
(3)Basic use of WinDbg
All right, enough of this nonsense. it's time to get into the text.
When it comes to anti debugging, the most simple and easy-to-use counter test is to use Windows's debugging API directly. For example, the isDebuggerPresent function.Let's use VS to write a few sections of the code to try.
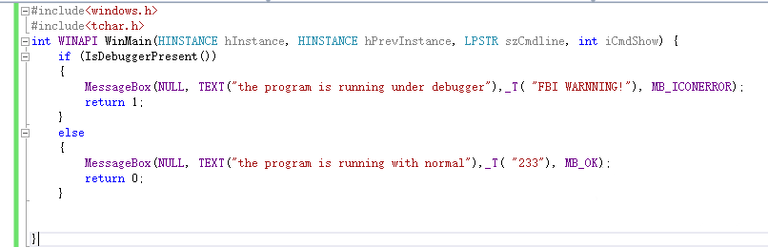
Build exe program after compilation and link completion
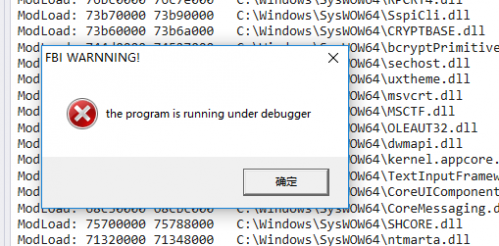
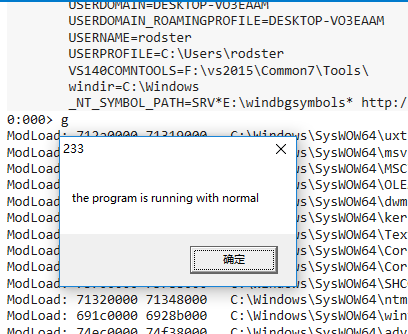
The error box pops up at the end of debugging using WinDbg.
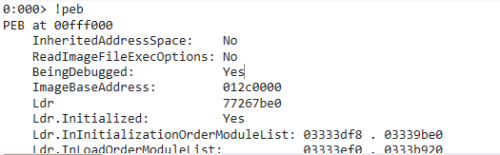
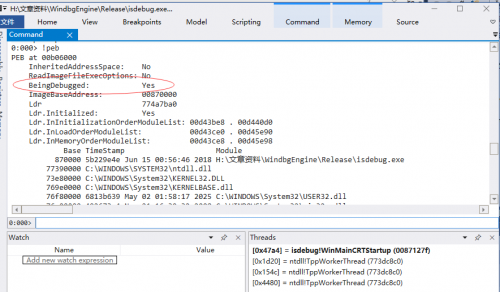
So how does IsDebuggerPresent implement the debugger? Referring to the reference material, it is known that the PEB structure member variable UCHAR BeingDebugged of the current process is used to determine whether the process is debugged by the debugger. Is this really the case? Let's see for ourselves. After all, seeing is believing.
After Windbg loading the program, WinDbg stops at the system breakpoint. Use the command Bu 0x012c1000 to point the breakpoint to the WinMain function entry point, and of course the ImageBaseAddress of each program may be different, using the! PEB command to get ImageBaseAddress. Then the address that ImageBaseAddress+0x1000 gets is WinMain function address (only in this way to do so, the rest of the environment is not guaranteed). Of course, you can also use the command R $exentry to see where the entry point is, and then single step to the WinMain function.
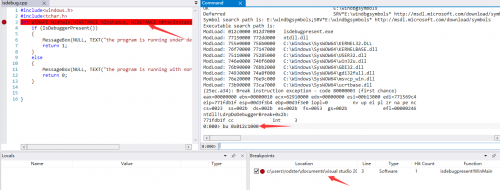
Press F 5 or enter the command G will run to WinMain. Enter the command U to view the current instruction.
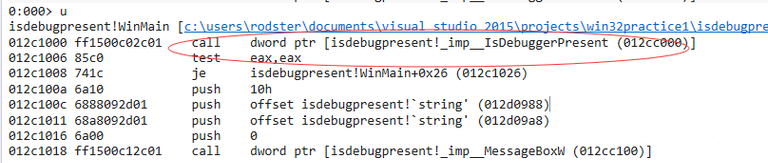
We can see that as soon as we enter WinMain, we immediately call the isdebugpresent function.
Follow it in and see how it works:
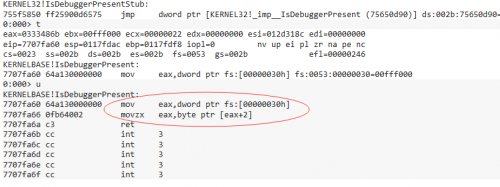
Here we need to know two positions, TEB and PEB. The 0x30 address of TEB offset is the address of PEB, PEB is cheap 0x2 is BeingDebugged member. You can use the! PEB command to view its member of the structure.
That's how IsDebuggerPresent determines whether or not it's debugged.
Now let's try to change the member value.
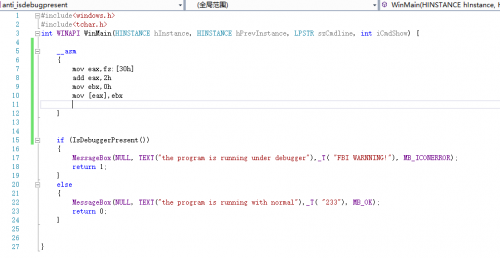
Using inline assembly, the address of BeingDebugged is directly copied to 0.
Compile, link, debug verify that reverse debugging was successful.
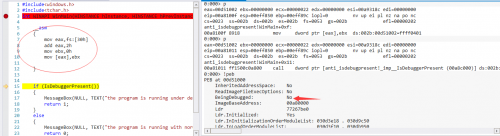
Look at the diagram. by the time you run to the if branch, its PEB struct member BeingDebugged has become NO (that is, its value is 0), and the input command G runs.
Pop-up is normal
Okay, this is actually the beginning of the real thing.
Now let's turn the code into WinDbg plug-in.When it comes to extensions, you have to mention so many extensions. The WinDbg extension model has 3 kinds of DbgEng, WDbgExts and EngExtCpp.
extend:DbgEng
↓
introduce:Based on COM, and interact with the main debugging engine through the COM interface.
extend:WDbgExts
↓
introduce:The initial model, implemented through the common C function interface.
extend:EngExtCpp
↓
introduce:An extended library based on C++.
Here we use the DbgEng extension model. Using vs to build a DLL project.
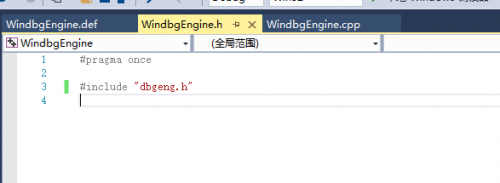
Create a new header file, WindbgEngine. H, including dbgeng. H header file, which is required for all debugging extensions using the DbgEng model.
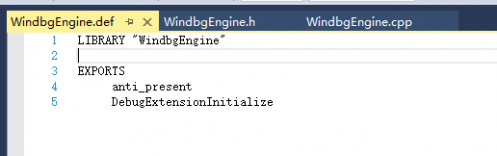
Add source file def suffix file as follows, library name and export function.
                       Here's the point

                    WindbgEngine. Cpp
#include "WindbgEngine.h"//包含头文件
HRESULT CALLBACK DebugExtensionInitialize(PULONG Version, PULONG Flags)//[color=#00ff][font=Verdana, Arial, Helvetica, sans-serif]DebugExtensionInitialize这个回调函数是必须被调用的,所以必须要存在。基本上都是固定的。功能是初始化版本和COM接口[/font][/color]
{
*Version = DEBUG_EXTENSION_VERSION(1, 0);
*Flags = 0; // Reserved for future use.
return S_OK;
}
HRESULT CALLBACK anti_present(PDEBUG_CLIENT pDebugClient, PCSTR args)//anti_present是导出的命令。PDEBUG_CLIENT是IDebugClient的别名
{
UNREFERENCED_PARAMETER(args);//[color=#4f4f4f][font="][size=16px]UNREFERENCED_PARAMETER 展开传递的参数或表达式。其目的是避免编译器关于未引用参数的警告。你可以删除掉,只不过编译的时候多了个警告而已。[/size][/font][/color]
    IDebugControl* pDebugControl;//IDebugControl接口,通过这个接口可以使用许许多多的命令,详情见参考资料
    if (SUCCEEDED(pDebugClient->QueryInterface(__uuidof(IDebugControl4), (void **)&pDebugControl)))
    {
            char command[20] = "ed $peb+2 00";//要执行的windbg命令,ed表示修改内存,$peb代表peb结构的地址,00是要修改的值
            pDebugControl->Outp.
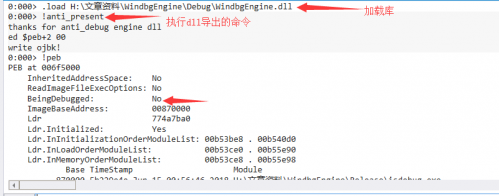
All right, that's it for today
Congratulations @clownmask! You received a personal award!
You can view your badges on your Steem Board and compare to others on the Steem Ranking
Do not miss the last post from @steemitboard:
Vote for @Steemitboard as a witness to get one more award and increased upvotes!