For education purposes only.
Price (sideways, narrowing)
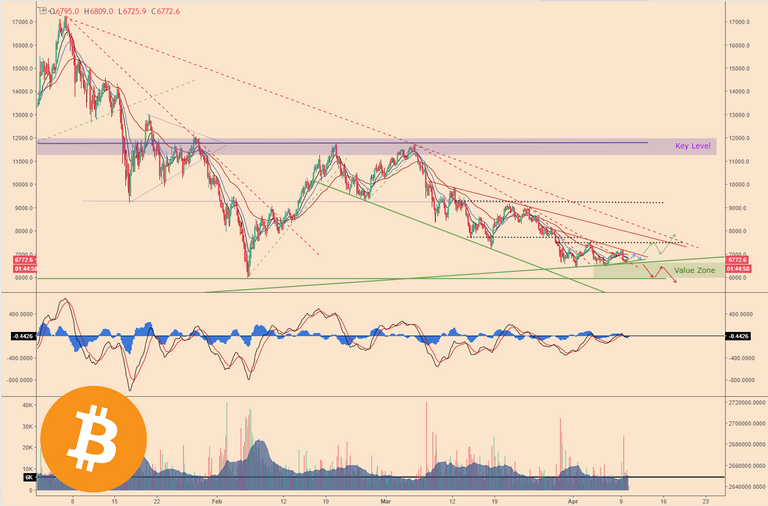
Following on from yesterday's price review (here), the BTC price took a plunge from $7,200 to $6,600.
In retrospect, on the hourly chart, there was obvious indicator divergence on the MCAD (i.e. price was rising whilst MACD was falling):
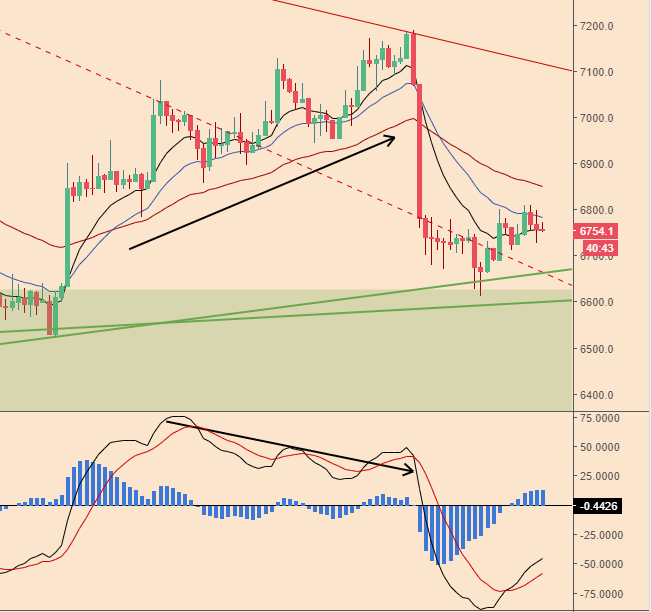
Clear indicator divergence (in traditional markets) is a fairly reliable sign that the current move is not going to continue, but is difficult to spot in real time.
The current price formation looks to be in a triangle squeeze, with reducing volatility, so we should keep an eye on the break for this formation for a return of volatility.
Volume (low)
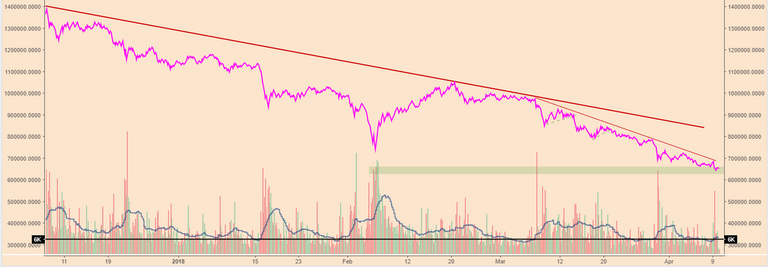
Average trading volume (4hr) on Bitfinex is around the 6k mark and the On-Balance-Volume (OBV) indicator (pink line) continues to weaken, suggesting sellers are firmly in control.
Strategy (long, reversal)
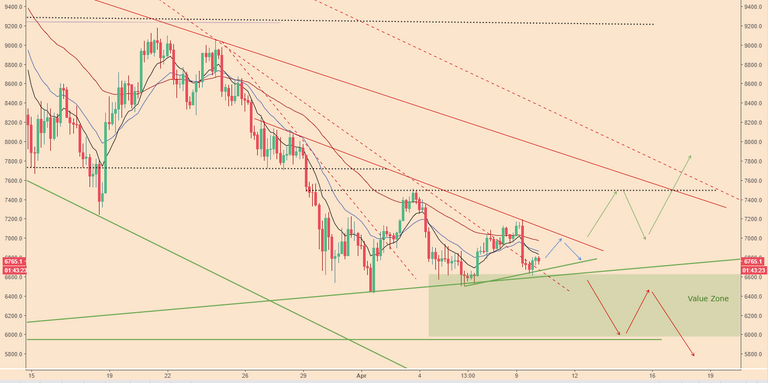
Still waiting for an obvious reversal signal. Clearly the market could continue its downtrend (which is the probably the more likely scenario), however, my current strategy is for a long entry. But have to be careful of a false move.
I need to see the price make a convincing higher high and higher low, before attempting a trade. That would mean a close above the $7,200 level and a subsequent pullback to make a low higher than $6,600. If this was accompanied by an uptick in volume and indicator agreement, I would be considering a long entry, either as a break (buy stop) or a pull back (buy limit), depending on the price formation.
Until tomorrow,
Bobby
(trader)