photo from the atheletic.com | also image credit links are all at the bottom/end of this article
Though experience tells us that “clutch” is real, it is devilishly hard to measure
in any sport. But in basketball specifically, what does it mean to be clutch?
A clutch player is thought to be someone that teammates can rely on, in the most pressurised
of situations. So, presumably, helping a team win close games is a major indicator of “clutchness.”
But, here is where we run into our first big problem. Studies going back more than a decade
have found little in the way of evidence suggesting teams have any special ability, or lack thereof,
to win close games.
Close games aren’t exactly coin flips. In this study, better teams win in clutch situations more frequently than worse teams. However, they win them at lower rates than “non-clutch” games. To isolate “clutch” as much as possible, The Athletic defines the term fairly narrowly. Looking at team performance, they only count games with a margin of three or fewer points at some time in the last two minutes of the fourth quarter.
Using that definition, The Athletic looked at team records in games qualifying as clutch from 1996-97 to 2018-19 and compared them to performance in all other games within a given season. As mentioned above, teams that were good at winning non-clutch games were generally better at winning these very close “clutch” games, but late/close situations evened the odds considerably. Over that span, a simple linear regression modeling clutch record based on broader performance predicts a team winning at a 60-win pace (73.2 win percent) in non-clutch games to a 47-win pace (57.4 win percent) in clutch games. On the flip side, the model would predict that a team winning 24.4 percent of non-clutch games (20-win pace) would jump up to 41.7 percent (just over 34-win pace) in clutch situations.
So for better teams, the lesson is that the best way to win close games is to not play close games. Of course, every season a number of teams dramatically overperform and underperform their overall trends in “clutch” games. Last year, the Nuggets (54-28) and Clippers (48-34) won 5.8 and 5.5 more “clutch” games respectively than would be predicted by their play in the remainder of games, while the Thunder (49-33) ran five games under the simple model’s prediction. While it might be tempting to build a narrative about the character of certain teams based on clutch performance, history suggests that to do so would be a case of being fooled by randomness. Over the same 23-year sample, there is virtually no correlation between teams’ level of overperformance or underperformance in clutch games from one year to the next: To restate, there is little evidence that teams have a particular ability or lack thereof to win close games that is consistent from one season to the next.
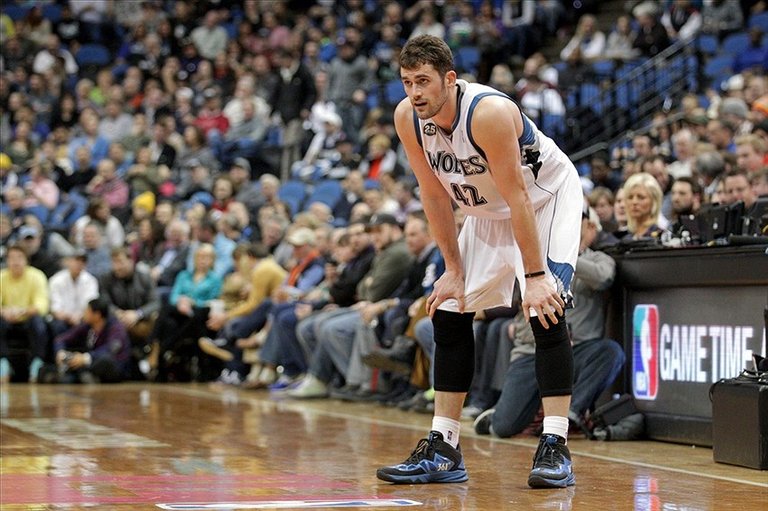
Of course, given the size of the study, there are examples of teams that seem to always excel or disappoint in these scenarios. Minnesota, had a worse clutch record than expected every season from 2007-08 to 2014-15, while Memphis was at least three clutch wins above expectations five of six years from 2011-12 to 2016-17. We can’t rule out there being something systematic about these streaks of performance, and it is certainly enticing to note that time period is the height of the Grit’n’Grind era for Memphis while those Wolves teams (and more pertinently, Kevin Love in particular), were viewed as simply not having what it took to close out tight games. But as real as those factors might feel, they are not readily distinguishable from normal variance rather than something intrinsic to those teams.
So, if it is hard to describe a team as consistently clutch, what about players? Given the primacy of stars in the NBA, surely the best of the best can be shown to rise to the moment, right? Much as with teams, the precise definition of clutch can skew the analysis, so it is important to be specific. So, going back to the 2004-05 season, The Athletic looked at every shot taken with the chance to tie or take the lead with under 30 seconds remaining in the fourth quarter or overtime. The first thing to note is this has proven to be an incredibly difficult situation for players as evidenced by an overall average of 29.8 FG percent on these “hero shots” as we’ll call them. Exactly why efficiency drops so much in these situations is a discussion unto itself.
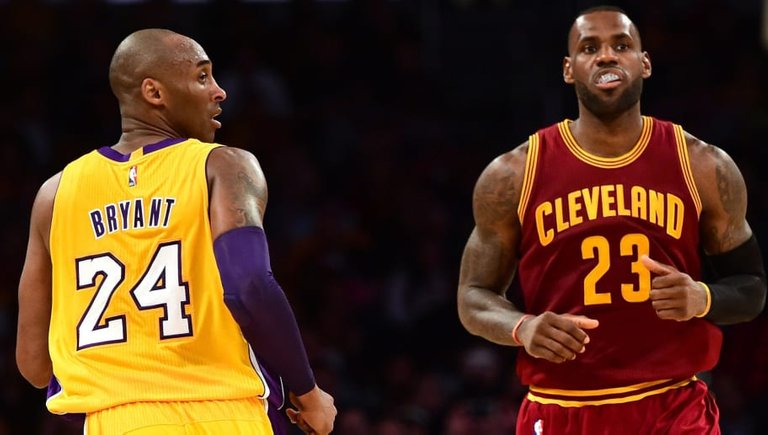
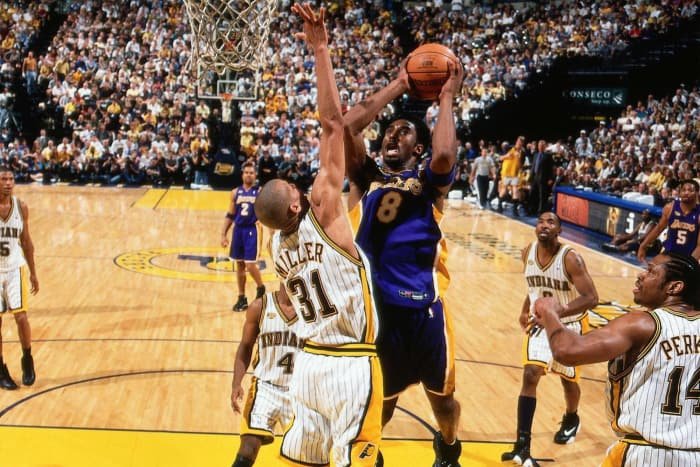
A brief theory is that the constraints of these moments remove much of the element of deception. The defense will usually have a pretty good idea of both who will take the shot (the offensive team’s best perimeter player) and when they will take it as dictated by time and score. This low overall efficiency is the first blow against the tradition of castigating players who fail to score in these scenarios. Much like a baseball player hitting .350 is cause for celebration, consistently shooting 35 percent on game winners would place a player among the best ever. Consistency is a key word there. Only seven players have taken even 100 “hero shots” since 2004-05, and conveniently for debate purposes LeBron James and Kobe Bryant are tied for most attempts at 128.
As with a team’s clutch record over a season tending towards a number predicted by their non-clutch play, some players have hit more or less frequently than that roughly 30 percent historical average. But as attempts increase, overall accuracy on game-winning shots regresses heavily towards that mean: Plotting in some names, it’s hard to discern much of a pattern in which players are above or below that 30 percent line, though it is revealing how heavily attempts in this situation skew towards perimeter players. While we do not have the data to fully explore the circumstances of pre-tracking era games, it seems likely that the players in the top left corner (such as Tim Duncan and Anthony Davis) are not getting the same mix of shots as those with more voluminous attempts. Naturally, finishing off a putback or dump-off from a teammate at the rim is a considerably easier attempt, even in the most pressure-packed moments, than breaking down a set defense by oneself.

But unless the entire coaching profession is completely incompetent, those easier shots are exceptions rather than the rule. Much as with teams that overperformed, it is tempting to point to players such as Dirk Nowitzki and Chris Paul and suggest there is something inherent about their games that make them uniquely clutch. And that might be true. Those two, along with Carmelo Anthony and Joe Johnson, rather famously subsisted on the sort of pullup two pointers that tend to be the result of the late-game isolations. So it might stand to reason that these players are better equipped to come through than others given they were operating in their normal comfort zones. However, consider the overall distribution of “extra” makes for players with at least 20 “hero” attempts over that span: While this distribution is not proof that performance in these late-game scenarios is essentially a 70/30 weighted coin flip, it is pretty much what it would look like if it were. This is not to say that “clutchness” doesn’t exist, but it’s more of a qualitative factor than something for which there are precise parameters.
Close games aren’t exactly coin flips. In this study, better teams win in clutch situations more frequently than worse teams. However, they win them at lower rates than “non-clutch” games. To isolate “clutch” as much as possible, The Athletic defines the term fairly narrowly. Looking at team performance, they only count games with a margin of three or fewer points at some time in the last two minutes of the fourth quarter.
Using that definition, The Athletic looked at team records in games qualifying as clutch from 1996-97 to 2018-19 and compared them to performance in all other games within a given season. As mentioned above, teams that were good at winning non-clutch games were generally better at winning these very close “clutch” games, but late/close situations evened the odds considerably. Over that span, a simple linear regression modeling clutch record based on broader performance predicts a team winning at a 60-win pace (73.2 win percent) in non-clutch games to a 47-win pace (57.4 win percent) in clutch games. On the flip side, the model would predict that a team winning 24.4 percent of non-clutch games (20-win pace) would jump up to 41.7 percent (just over 34-win pace) in clutch situations.
So for better teams, the lesson is that the best way to win close games is to not play close games. Of course, every season a number of teams dramatically overperform and underperform their overall trends in “clutch” games. Last year, the Nuggets (54-28) and Clippers (48-34) won 5.8 and 5.5 more “clutch” games respectively than would be predicted by their play in the remainder of games, while the Thunder (49-33) ran five games under the simple model’s prediction. While it might be tempting to build a narrative about the character of certain teams based on clutch performance, history suggests that to do so would be a case of being fooled by randomness. Over the same 23-year sample, there is virtually no correlation between teams’ level of overperformance or underperformance in clutch games from one year to the next: To restate, there is little evidence that teams have a particular ability or lack thereof to win close games that is consistent from one season to the next.
Of course, given the size of the study, there are examples of teams that seem to always excel or disappoint in these scenarios. Minnesota, had a worse clutch record than expected every season from 2007-08 to 2014-15, while Memphis was at least three clutch wins above expectations five of six years from 2011-12 to 2016-17. We can’t rule out there being something systematic about these streaks of performance, and it is certainly enticing to note that time period is the height of the Grit’n’Grind era for Memphis while those Wolves teams (and more pertinently, Kevin Love in particular), were viewed as simply not having what it took to close out tight games. But as real as those factors might feel, they are not readily distinguishable from normal variance rather than something intrinsic to those teams.
So, if it is hard to describe a team as consistently clutch, what about players? Given the primacy of stars in the NBA, surely the best of the best can be shown to rise to the moment, right? Much as with teams, the precise definition of clutch can skew the analysis, so it is important to be specific. So, going back to the 2004-05 season, The Athletic looked at every shot taken with the chance to tie or take the lead with under 30 seconds remaining in the fourth quarter or overtime. The first thing to note is this has proven to be an incredibly difficult situation for players as evidenced by an overall average of 29.8 FG percent on these “hero shots” as we’ll call them. Exactly why efficiency drops so much in these situations is a discussion unto itself.
A brief theory is that the constraints of these moments remove much of the element of deception. The defense will usually have a pretty good idea of both who will take the shot (the offensive team’s best perimeter player) and when they will take it as dictated by time and score. This low overall efficiency is the first blow against the tradition of castigating players who fail to score in these scenarios. Much like a baseball player hitting .350 is cause for celebration, consistently shooting 35 percent on game winners would place a player among the best ever. Consistency is a key word there. Only seven players have taken even 100 “hero shots” since 2004-05, and conveniently for debate purposes LeBron James and Kobe Bryant are tied for most attempts at 128.
As with a team’s clutch record over a season tending towards a number predicted by their non-clutch play, some players have hit more or less frequently than that roughly 30 percent historical average. But as attempts increase, overall accuracy on game-winning shots regresses heavily towards that mean: Plotting in some names, it’s hard to discern much of a pattern in which players are above or below that 30 percent line, though it is revealing how heavily attempts in this situation skew towards perimeter players. While we do not have the data to fully explore the circumstances of pre-tracking era games, it seems likely that the players in the top left corner (such as Tim Duncan and Anthony Davis) are not getting the same mix of shots as those with more voluminous attempts. Naturally, finishing off a putback or dump-off from a teammate at the rim is a considerably easier attempt, even in the most pressure-packed moments, than breaking down a set defense by oneself.
But unless the entire coaching profession is completely incompetent, those easier shots are exceptions rather than the rule. Much as with teams that overperformed, it is tempting to point to players such as Dirk Nowitzki and Chris Paul and suggest there is something inherent about their games that make them uniquely clutch. And that might be true. Those two, along with Carmelo Anthony and Joe Johnson, rather famously subsisted on the sort of pullup two pointers that tend to be the result of the late-game isolations. So it might stand to reason that these players are better equipped to come through than others given they were operating in their normal comfort zones. However, consider the overall distribution of “extra” makes for players with at least 20 “hero” attempts over that span: While this distribution is not proof that performance in these late-game scenarios is essentially a 70/30 weighted coin flip, it is pretty much what it would look like if it were. This is not to say that “clutchness” doesn’t exist, but it’s more of a qualitative factor than something for which there are precise parameters.
PHOTO SOURCE/S;