$BAT Price Analysis

Basic Attention Token Price Analysis
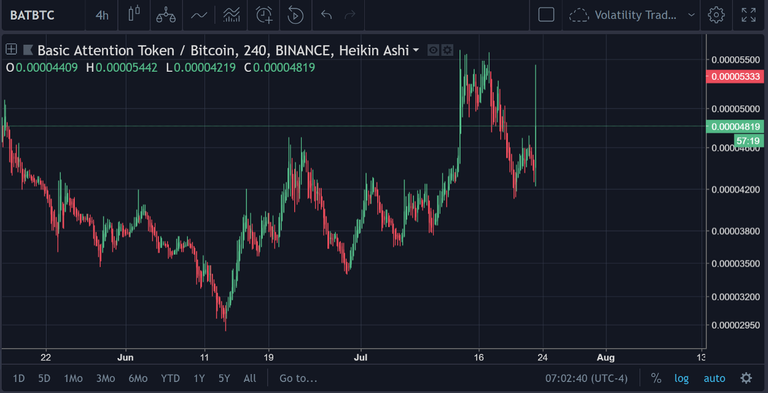
The surge in the price of $BAT as I’m writing this is not readily apparent until you zoom in on the 1H chart.


This represents a 22%+ gain in a short period of time.
Interestingly, this presents a unique challenge in a lot of ways, because we don’t want to let extraneous data on the chart (i.e., a quick P&D) cause a spike in our readings that render a false positive (i.e., buy signal).
So, what do we do from here?
#1 — Check Fundamentals
Must logical option here is to check out if there is anything that is going on w $BAT that would justify this massive spike in the price.
Timeline
_From raising $36M in less than 30 seconds to partnerships with leading publishers and YouTube stars, here’s the…_basicattentiontoken.org
Looks like there wasn’t any major release on the protocol recently, so we can rule that out.
BasicAttentionToken (@AttentionToken) | Twitter
_The latest Tweets from BasicAttentionToken (@AttentionToken). Blockchain-based digital advertising. San Francisco, CA_twitter.com
There’s no information on the Twitter that would corroborate this either.
But, regardless, as I am writing this, the price has moved up to $5.5k.
I’m going to assume that this is not rooted in any fundamentals, because I did a few other searches and did not find anything reliable to explain this.
So What Do You Do When You See the Price Pumping Like This (Obviously)
You’ve probably heard the ‘maxim’, don’t invest in green candles!
That’s stupid.
What you really need to do is just move to a bigger time frame.
So, I’m going to go to the daily chart now.
Here’s what I see that grabs my attention at first sight:

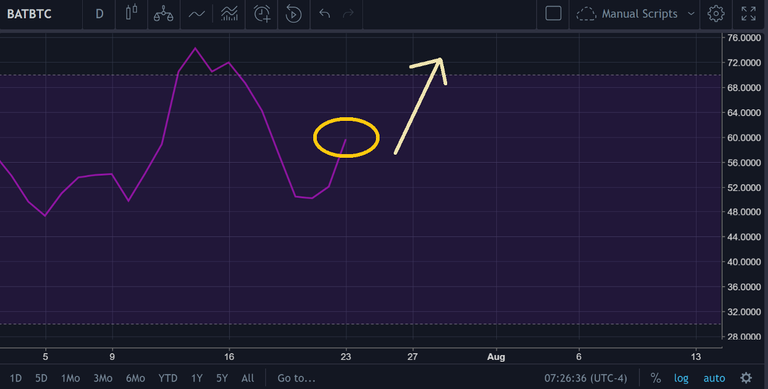
As you can see, there’s a distinct bounce in the price that can be seen from $4.3k, which is the point where the price meets that short-term uptrend that’s held itself since June 13th.
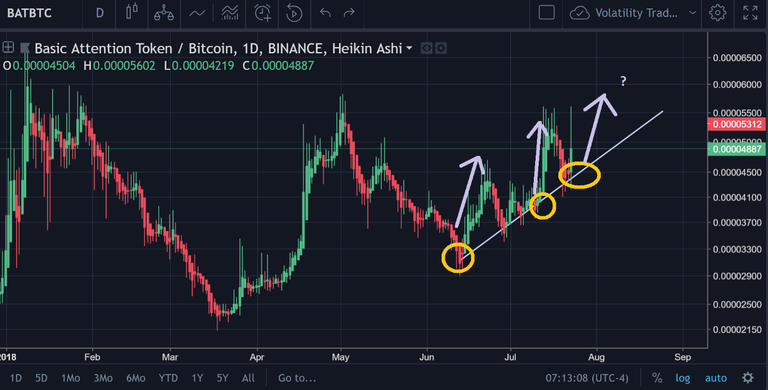
Based on what we’ve seen in the last days, this pattern has held pretty reliably. So, if this still holds (which it looks like it is at the moment), then it looks like the price should appreciate over the next couple of days regardless.
Perhaps there are other traders that sensed this as well and they are also hopping into the trade.
It’s also worth noting that $BTC has moved up slightly in price too, which is something that typically precedes a small burst in the price.
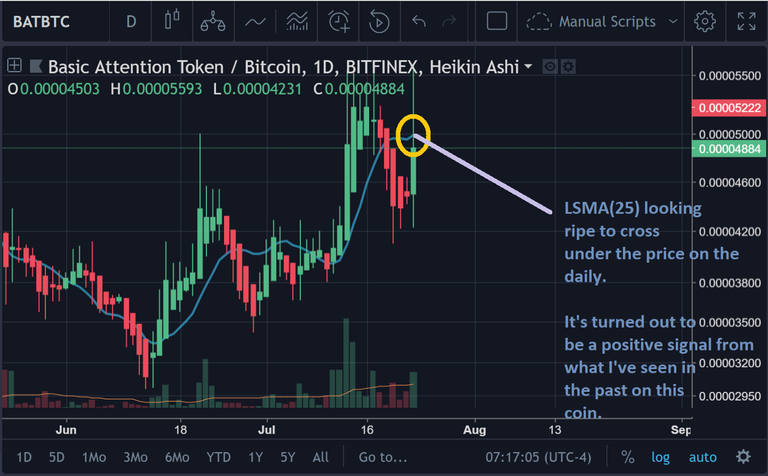
The LSMA is giving us a very positive outlook as well. It appears as though the price is on the precipice of triggering a buy signal here.
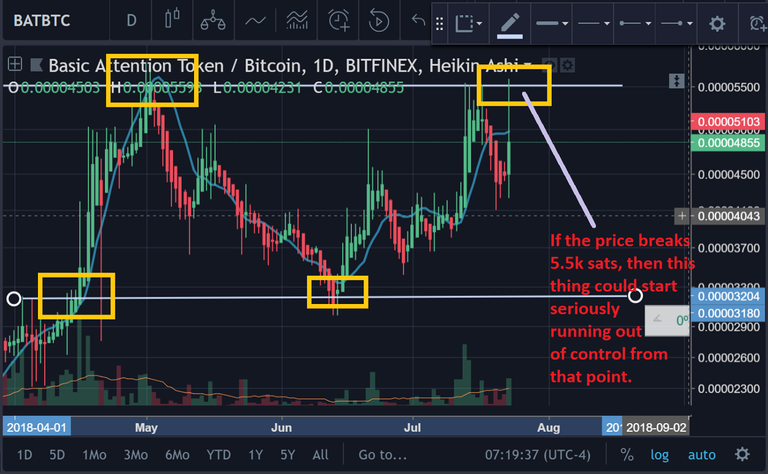
So, this picture might not be the clearest, but what I wanted to show above is the fact that $BAT/BTC is in a trading range right now.
The range is 3.2k to 5.5k.
So, from where the price is right now, there’s a 8%-ish that could be gained (remember that it could fluctuate a lot as there is an influx of volume that has come out of nowhere).

This is the Balance of Power chart here on the daily.
It’s looking a little iffy, and this does concern me a bit. This is something that would make me set a much tighter S/L, because this is an indicator that typically precedes price action, rather than lagging after it like Exponential Moving Averages or something like that.
If you don’t know what I’m talking about when I mention leading and lagging indicators, you should check out this article that I wrote about it that dissects it down to a science.
Critical Information on Technical Indicators (Pt. 1)
_Twitter: @CryptoMedicated_medium.com
There’s still room for the RSI(14) [on the daily] for $BAT to keep moving upward.
Conclusion
Based on everything that I’ve seen, this is a tentative play right here. I would set a tight S/L on this one (going long) at 5k sats flat most likely. That seems fair to ensure that it can protect us without stopping us from losing solid profits that could be generated.
I would then set up a sell order at 5.5k sats flat. Perhaps a little bit beneath that (exchanges tend to have a little bit of a problem breaking through points like that for some reason; perhaps this is just some, sorry I’m a book watcher at times when I’m bored!).
We’ll have to see how this plays out.
Check out the visual of trading strategy below:# $BAT Price Analysis
Basic Attention Token Price Analysis
The surge in the price of $BAT as I’m writing this is not readily apparent until you zoom in on the 1H chart.
This represents a 22%+ gain in a short period of time.
Interestingly, this presents a unique challenge in a lot of ways, because we don’t want to let extraneous data on the chart (i.e., a quick P&D) cause a spike in our readings that render a false positive (i.e., buy signal).
So, what do we do from here?
#1 — Check Fundamentals
Must logical option here is to check out if there is anything that is going on w $BAT that would justify this massive spike in the price.
Timeline
_From raising $36M in less than 30 seconds to partnerships with leading publishers and YouTube stars, here’s the…_basicattentiontoken.org
Looks like there wasn’t any major release on the protocol recently, so we can rule that out.
BasicAttentionToken (@AttentionToken) | Twitter
_The latest Tweets from BasicAttentionToken (@AttentionToken). Blockchain-based digital advertising. San Francisco, CA_twitter.com
There’s no information on the Twitter that would corroborate this either.
But, regardless, as I am writing this, the price has moved up to $5.5k.
I’m going to assume that this is not rooted in any fundamentals, because I did a few other searches and did not find anything reliable to explain this.
So What Do You Do When You See the Price Pumping Like This (Obviously)
You’ve probably heard the ‘maxim’, don’t invest in green candles!
That’s stupid.
What you really need to do is just move to a bigger time frame.
So, I’m going to go to the daily chart now.
Here’s what I see that grabs my attention at first sight:
As you can see, there’s a distinct bounce in the price that can be seen from $4.3k, which is the point where the price meets that short-term uptrend that’s held itself since June 13th.
Based on what we’ve seen in the last days, this pattern has held pretty reliably. So, if this still holds (which it looks like it is at the moment), then it looks like the price should appreciate over the next couple of days regardless.
Perhaps there are other traders that sensed this as well and they are also hopping into the trade.
It’s also worth noting that $BTC has moved up slightly in price too, which is something that typically precedes a small burst in the price.
The LSMA is giving us a very positive outlook as well. It appears as though the price is on the precipice of triggering a buy signal here.
So, this picture might not be the clearest, but what I wanted to show above is the fact that $BAT/BTC is in a trading range right now.
The range is 3.2k to 5.5k.
So, from where the price is right now, there’s a 8%-ish that could be gained (remember that it could fluctuate a lot as there is an influx of volume that has come out of nowhere).
This is the Balance of Power chart here on the daily.
It’s looking a little iffy, and this does concern me a bit. This is something that would make me set a much tighter S/L, because this is an indicator that typically precedes price action, rather than lagging after it like Exponential Moving Averages or something like that.
If you don’t know what I’m talking about when I mention leading and lagging indicators, you should check out this article that I wrote about it that dissects it down to a science.
Critical Information on Technical Indicators (Pt. 1)
_Twitter: @CryptoMedicated_medium.com
There’s still room for the RSI(14) [on the daily] for $BAT to keep moving upward.
Conclusion
Based on everything that I’ve seen, this is a tentative play right here. I would set a tight S/L on this one (going long) at 5k sats flat most likely. That seems fair to ensure that it can protect us without stopping us from losing solid profits that could be generated.
I would then set up a sell order at 5.5k sats flat. Perhaps a little bit beneath that (exchanges tend to have a little bit of a problem breaking through points like that for some reason; perhaps this is just some, sorry I’m a book watcher at times when I’m bored!).
We’ll have to see how this plays out.
Check out the visual of trading strategy below: