UPDATE Feb 16, 2020
Just now setup my desktop computer in my new apartment in Texas, so I could see what happened to the cryptocurrency prices the past two days.
I had my bid (buy) prices set for LTC/BTC from 0.0075 down to 0.0073, for ETH/BTC from 0.026 down to 0.025, for GRS/BTC from 0.000024 down to 0.000023. So obviously all of those filled during my absence over the past two days as I expected. Remember I stated in my recent blog that on the BTC chart there was a bearish rising wedge and the price would drop out causing a flash crash on the altcoins. I expected BTC to test the bottom of the rising bearish wedge on Sunday Feb. 16.
The altcoins moved to my absolute bottom targets relative to BTC, because the BTC price fell out of the wedge without bouncing to $11k after declining to the $10k bottom of the wedge — i.e. $10.5k was the top thus far and the wedge appears to have already peaked. My bids were set a bit higher than the absolute possible bottoms because I wasn’t sure whether BTC would decline to $10k then bounce to $11k (before falling out of the bearish rising wedge) thus possibly taking the altcoins to the next level higher relative to BTC before falling out of the wedge. I’m okay without missing the absolute bottoms of this bullish correction on the altcoins by about 5 – 10%. At least I bought back the altcoins for less than the price I sold them in early February.
URGENT: probably better jump on those altcoins now. BTC will likely to decline to between $9k and $9.5k over this week, but the altcoins will then start to moon w.r.t. to BTC as they also did in March 2019. Then next sudden lurch/surge upwards for BTC will send the altcoins to nosebleed levels. That should be in March 2020 and the altcoins should be traded (sold) for BTC then.
Maximum possible downsides for BTC is into the low-to-mid $8000s, but during Feb – April 2019, BTC only declined to the green 50 DMA on my charts. Thus it appears $9k will probably be the lowest. As it becomes clear BTC is not headed below $9k, the altcoins will start mooning. The market has shifted to bullish with some apprehension. AS the apprehension turns to FOMO, then the mooning.
UPDATE Feb 17, 2020
Started writing the following later in the day on Feb 16, but am finishing and posting it on the morning of Feb. 17. Note I sold some of my LTC and ETH at break even on the bounce to 0.00754 and 0.0267 while I sort out my analyses as follows…
Updated Litecoin Analysis
Further careful study of the LTC/BTC chart reveals February 13, 2020 likely corresponded to the fractal pattern of second week of March 2019. The acceleration from the bottom is posited to be ~2.4X (i.e. 0.4X duration) and thus the price rise relative to the initial bounce off the bottom is also ~0.4X. Thus, projecting ~0.088 on February 20, 2020 as the peak LTC/BTC. We must sell/trade LTC into BTC at that 0.088 price! Possibly the peak can be up to a key overhead resistance line ~0.091 (c.f. chart below). Possibly a double-top on March 18, 2020 which will meet the overhead resistance of the (purple on my charts) 50 WMA.
Note the current correction could bottom as low as ~0.068, but the bottom is likely already be behind us at 0.070 because LTC/USD has likely bottomed on its bearish rising wedge (shown in section below) otherwise LTC/USD would fall out of the wedge.
Updated Groestlcoin Analysis
In light of this further insight into deceleration and fractal correlation, GRS/BTC will peak at an absolute maximum of ~0.000037 and the more likely peak is between ~0.000029 and 0.000030, although the leverage so far relative to LTC with the presumption of LTC/BTC rising to ~0.009 projects GRS/BTC 0.000038. However there’s a significant risk that GRS/BTC has already peaked, although it hasn’t yet made its higher leveraged gain relative to Litecoin as it did in 2019. And this correction could bottom as low as between ~0.000019 and 0.000020. Altcoin FOMO greater fool reservoirs are being depleted as these greater fools are wrecked (aka REKTD).
In hindsight, I regret repurchasing GRS because the liquidity, spreads, and risk/reward are horrendous with great difficulty in selecting an entry and exit price. Since exit prices are usually on a very short duration spike, they have to be chosen well in advance. I didn’t realize recently how much LTC/BTC had decelerated compared to 2019.
Updated Ethereum Analysis
ETH/BTC may have bottomed on this correction although a further decline to the purple 50 WMA ~0.024 seems plausible.
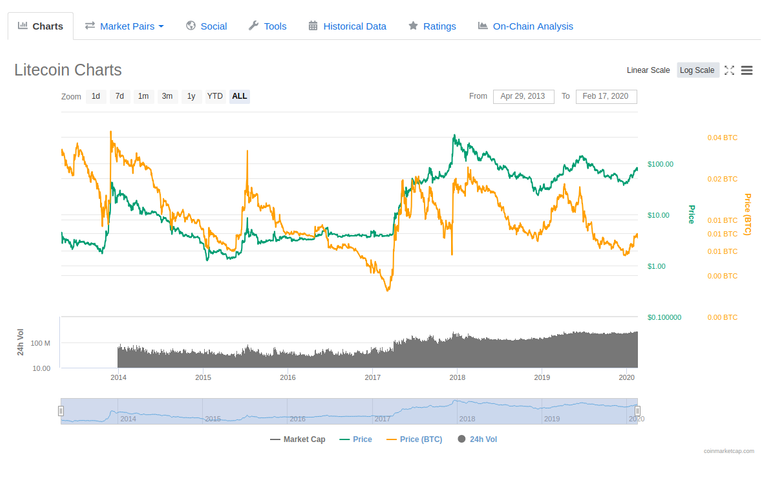
The long-term history of LTC/BTC exhibits lower lows and falling out the bottom of wedges, although LTC/USD is bullish:
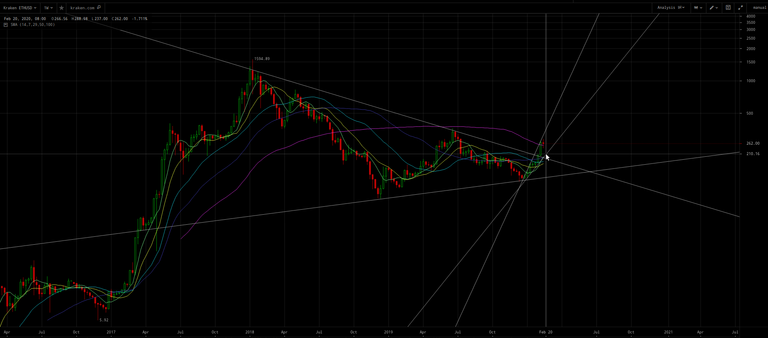
Whereas ETH/BTC exhibits higher highs and rising out of the top of wedges, and ETH/BTC is also bullish:
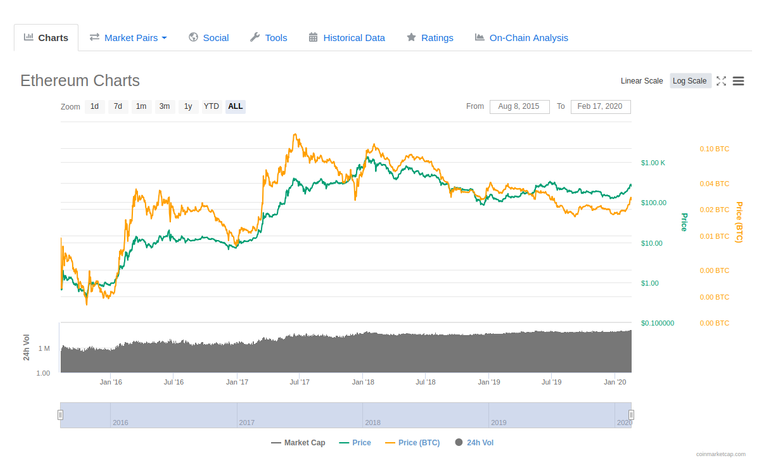
Note how twice before ETH/BTC corrected to just below its prior peak before rocketing up out of the bullish wedge to make a new high.
The following LTC/BTC chart helps to visualize the recent failed wedges, but also another key distinction from ETH/BTC occurred after January 3, 2019 as LTC/BTC subsequent outperformed ETH/BTC until April presumably because (delays for Ethereum’s promises to switch to proof-of-stake? and because) as stated ETH/BTC corrects to just below the prior peak before racing up to break up out of the bullish wedge:
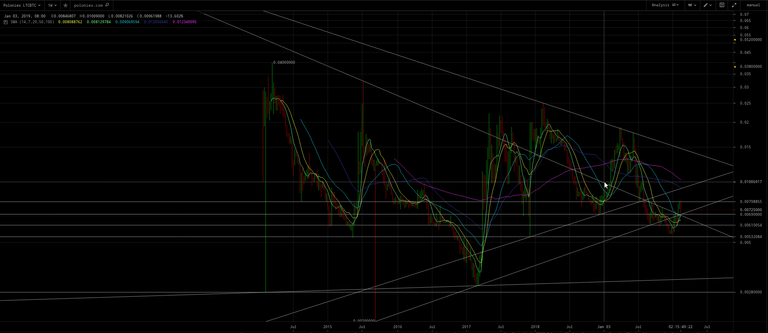
(click to zoom)
LTC/BTC is projected to peak at the purple 50 WMA (aka 350 DMA) and was repelled by a long-term horizontal confluence price level ~0.0081. Whereas, ETH/BTC has cleared the purple 50 WMA which is so far now acting as support on this correction:
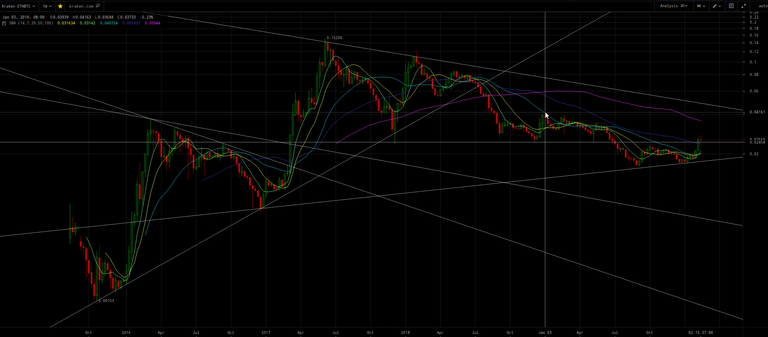
(click to zoom)
Whereas from the bottom in December up to January 3, 2019 ETH/BTC was slightly outperforming LTC/BTC but then subsequently fell way behind. Currently ETH/BTC is slightly outpeforming LTC/BTC since the bottom January 8, 2020. And has outperformed so far until later in the posited fractal correlation pattern cycle than when it failed to keep up after January 3, 2019.
Another bullish sign of ETH/BTC’s relative acceleration compared to LTC/BTC is that the cyan 200 DMA has already curled up and been bullish crossed up over by the 100 DMA. Whereas for LTC/BTC the 200 DMA is still decline and the 100 DMA is still below the 200 DMA. Note also that ETH/BTC and LTC/BTC are out-of-phase because the former fell out of its wedge July/August 2018 and the latter fell out of its wedge August 2019. Both had a double-top at the top of their wedges before falling down out of their wedges.
ETH/BTC thus appears headed up to at least the magenta 100 WMA ~0.036 for the aforementioned posited coming peak in February.
Further confirmation comes from analyzing the differences in the LTC/USD and ETH/BTC charts. Note the ominous signal on the former that the declining magenta 100 WMA is bearishly crossing under the rising purple 50 WMA. The former is also in a short-term, bearish, narrowing rising wedge which appears will lurch to ~$90+ on February 20ish, which should provide the posited LTC/BTC of ~0.009 as BTC/USD declines to its green 50 DMA ~$9k:
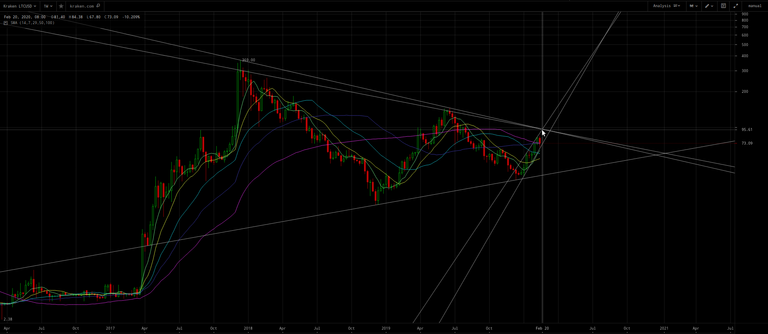
(click to zoom)
Tangential Note: I’m now leaning to the scenario of this BTC/USD decline being only the handle of a cup and handle, so plausibly limited to a brief correction to $9k only. And if correct, then BTC/USD is preparing to break up out of the massive, bullish wedge shown in the topmost chart on this blog! ∎
After that, LTC/BTC should decline anew instead of breaking up out the long-term, bullish wedge. And LTC/USD will likely break out of its bullish wedge as BTC rockets, but within the said bearish wedge — ultimately falling out of the bearish wedge perhaps in April causing LTC/BTC to plummet.
Whereas, ETH/USD has already broken up out of the long-term, bullish wedge and is also within a bullish, rising, broadening wedge:
(click to zoom)
But unlike LTC/BTC, ETD/USD has not likely bottomed yet for this correction, so a further decline of ETH/BTC to ~0.024 seems plausible. A surge up to the top of that broadening wedge February 20ish seems to the confirm the expectation of ETH/BTC ~0.035. By mid-March the top of the broadening wedge $600+ seems to confirm that ETH/BTC will reach the top of its long-term wedge ~0.048. If I’m correct about a $35+k BTC price by May, the upper line of the said broadening wedge (on ETH/USD) seems to confirm that ETH/BTC will hug the top of its long-term wedge until May down to ~0.043 before breaking up out as the posited crash of impostor Bitcoin Core (aka “BTC”) ensues.
IOW, take profits on ETH/BTC at 0.035 and 0.047 into legacy Bitcoin or other Segwit attack mitigation strategies mentioned in this blog.
Note the distinction between LTC and ETH appears to be ETH finally making concrete plans to switch to proof-of-stake, which will be immune to the barrage of attacks on proof-of-work altcoins coming after May 14. Whereas all proof-of-work altcoins except legacy Bitcoin (and especially those with the Segwit flaw such as Litecoin) will be toast after any Segwit attack posited to start May 14, 2020.
Yet the even for ETH/BTC, the magenta declining 100 WMA will bearishly cross under the purple 50 WMA before the May 14, 2020 halving event.
My interpretation of the altcoin charts seems to be confirming my posited Segwit attack scenario. Confirmation bias?
Also inserted the following to this blog:
I’ll add:
6. Trade BTC for ETH if latter has transitioned to proof-of-stake. Delays were intentional? Hmm. But ETH may not perform as well as legacy BTC (because proof-of-stake is captured by an oligarchy, Ethereum isn’t immutable, not the original, not going to be a global reserve currency asset, etc).
If bitcoin core (BTC) crashes after may 14, that means the alt coins market will crash really hard as well. Does it mean bitcoins on legacy wallet (starting with 1) will be worth something? If that is the case all alt coins should be converted to BTC before may and be sold before or after may 14, or I am getting this wrong? What will happen with BCH? Also, do you see any alt coin surviving this kind of disaster? Thanks