Hello friends, in this opportunity, I bring you a small opinion about Bitcoin, and its possible short term future movements, guiding me of several technical indicators, and some more tools.
I decided to make this short publication, after this good recovery, which has surprised me a lot, because I thought it was much more likely to get a new minimum, and I saw almost impossible a recovery this first quarter. But it has not been like that, and the market has achieved a small recovery, but what will happen next?
In my BTC criterion, it will remain for a few days in lateral trend, maybe 1 week or at most 2 weeks, before exploding again, up or down I do not know, I think nobody is sure of that. You can draw some conclusions, with these small summaries, or I hope so.

Trend Lines, Supports and Resistances
These last few days BTC has managed to overcome the downward trend line that I had since the end of November, and that is why I manage to get that big green candle. And I create a new line of upward trend in the short term, which seems to hold the price for the remainder of the month.
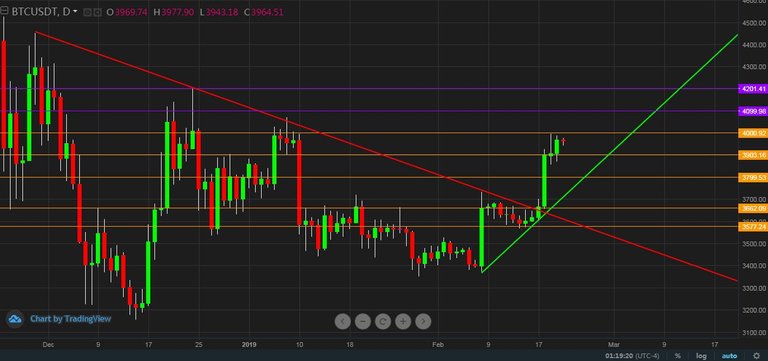
As for the support levels, I consider important for now in the short term, the levels of 3700 and 3900, approximately, which if lost, would take us back to the levels of 3600-3400. As for the resistors, the 4000 and 4100, I do not consider them very strong, since they could give us false signals. But I do believe that the resistance of 4200-4250 is extra important, and I think that if it is exceeded and consolidated, it could take us at least to touch the $ 5000.
Line of support for the long-term low
This line I have observed for quite some time, I find it quite interesting and very relevant to the Bitcoin movement. This line supported the price of Bitcoin, from the last ATH (2017) until mid November of last year. And then it has prevented any rise, bouncing the price on it, and sending it back down.
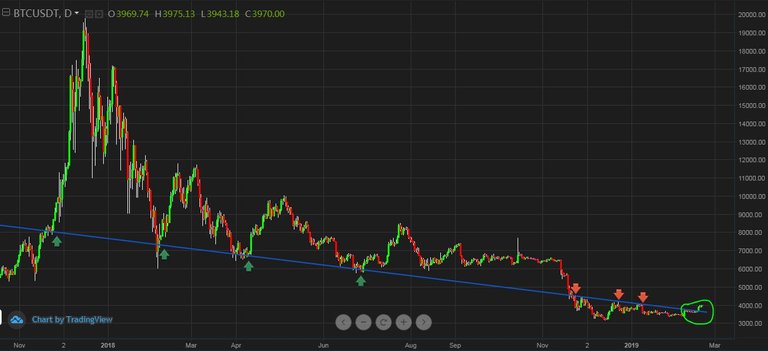
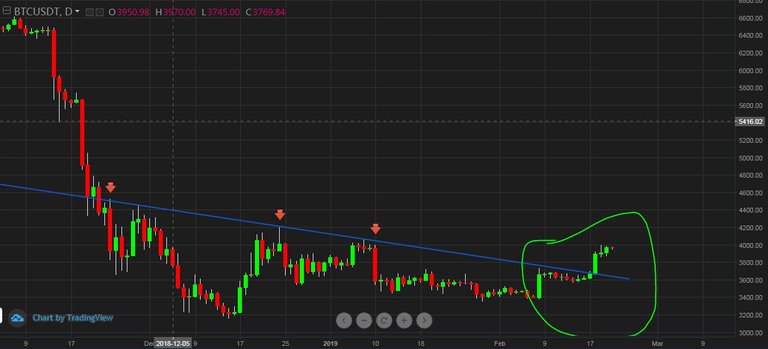
But with this last rise, this line has finally been "recovered" again, I still hope to confirm a few more days, but I think it would be good news, because of the relevance that I think this simple trend line has. In the next image you can observe it more closely (It is the same trend line that I showed in the first graphic)
EMAS (Triple cross)
I use 3 EMAs to represent the movements, one short, one medium and long term, which I established in 4, 18 and 40 periods (days) respectively. Clearly these last days there has been a triple cross stocking, which is a good buy sign. This positive crossover, did not happen in Bitcoin for a long time.

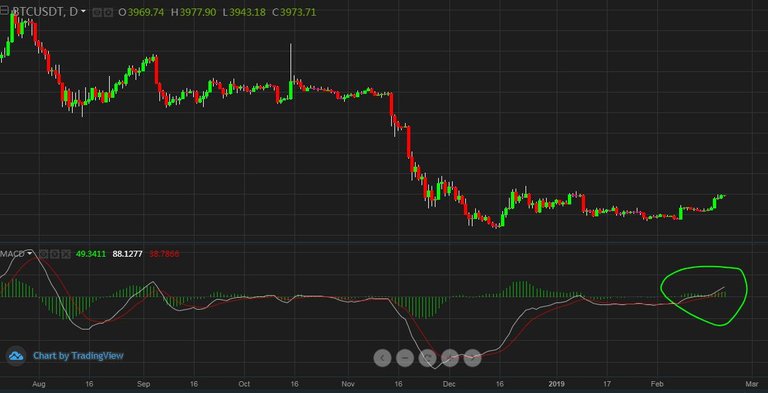
MACD
It shows good signs for now, since both means have managed to overcome the middle line. Something that did not happen months ago, but not yet confirmed at all, can be a false signal. I hope you can continue up and consolidate the rise. But I recommend selling if both lines grab the address below.
Stochastics
Same as above, both stochastic indicators show us a possible price ceiling for the next few days. Since they are at their maximum values. It may be probable, that this will show us a new correction below. But they can also lose validity, if the price manages to consolidate this new level for a few days.
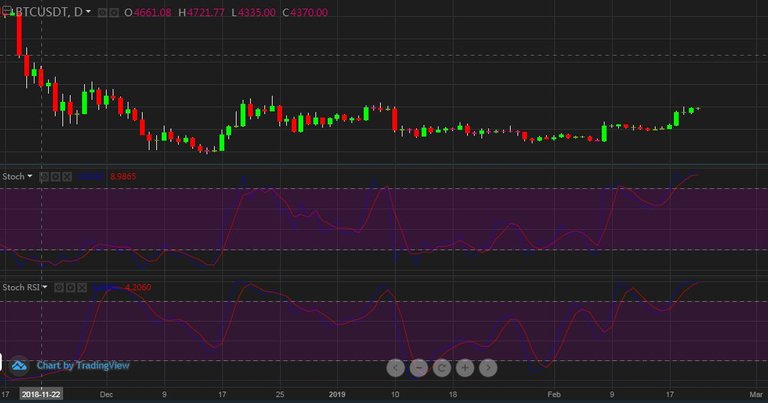
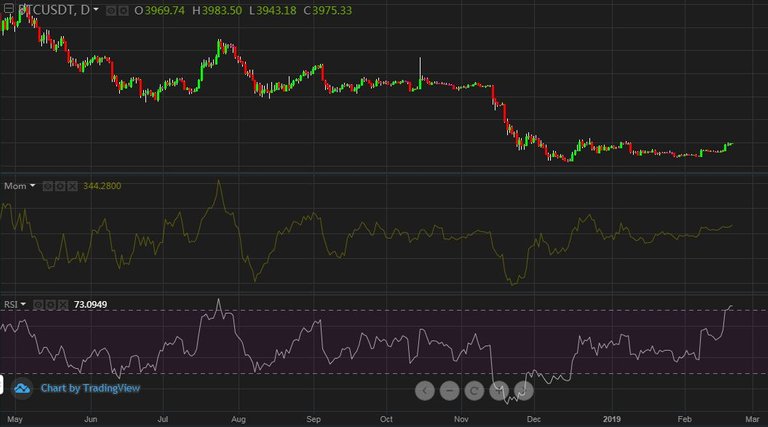
RSI / Momemtum
The RSI, similarly presents very high values, which indicate a possible ceiling, or a new consolidation, for a few days. I hope he does not show us a new fall. The momemtum for now remains on track, but I recommend taking precautions if it gets closer to the zero line.
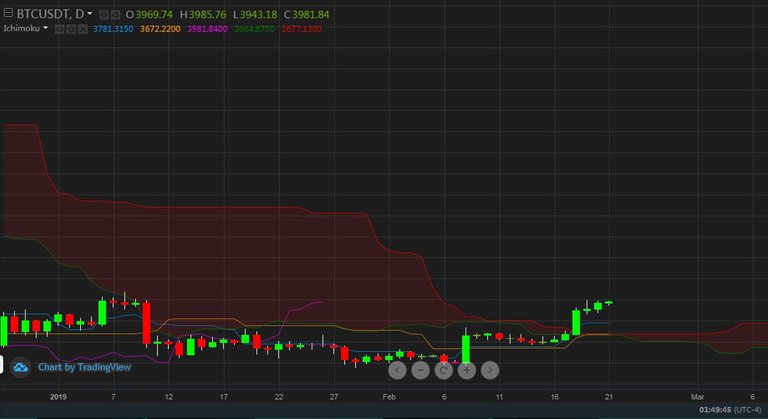
Ichimoku Clouds
This indicator seems very interesting to me, and although I have tried it very little, I was able to predict with it, the last rise. Thanks to the signal obtained by the moving average delayed 26 days (colour pink). Thanks to their analysis, which helps to predict much better the movements or better said, the break points next, this indicate is signaling us the formation of a very relevant support in 3600. But also it is worth noting, that BTC was more than 4 months without being able to pass the cloud above, this seems very interesting to me. I think a good boost, if the price comes to consolidate above the cloud, one or two weeks more. The main signal of rise will be if the pink line manages to overcome the cloud, but we must sell if this line falls below the cloud.
In conclusion, as always it is quite complicated to make a decision, I believe that we are in a moment where anything can happen. Some indicators and tools give us good signals, such as the MACD, the Ichimoku cloud, the media crossing and the last lines of overcome trends. But I still think we should wait a few days, so that these instruments are consolidated and guide us to a good path (Long)
But on the other side we have the RSI and Stochastics, which indicate a possible ceiling for its high values. Maybe it is a sign of a new low or correction, although this weekend I doubt it a lot, I think that besides that, they can also simply indicate the brake on the rise and the consolidation of this level for a few days.
NOTE: I have made this post, as informative material and in my personal opinion. I am not a financial advisor, just a simple fan of cryptocurrencies and trading. I recommend doing your own analysis to make a decision.

Hello , is anyone interested in receiving 500 steem power delegated for 7 days , for an article about a cryptocurrency projects, please check my latest post @greatvideos and let me know , or if you write an article every Monday and give it to me you can keep delegation for as long as you write articles
Congratulations @apple96! You have completed the following achievement on the Steem blockchain and have been rewarded with new badge(s) :
Click here to view your Board
If you no longer want to receive notifications, reply to this comment with the word
STOP