Over the last few weeks, Bitcoin has seen an aggressive sell off that has seemed endless. There are a lot of people making predictions about where the bottom will be, but the truth is that nobody really knows until it happens. The good thing is that there are ways of identifying the bottom so you can take advantage of lower prices.
This is a guide for anyone who feels overwhelmed by Bitcoin's price movements, and who maybe feels a little "lost in the sauce". Hopefully this guide will give some reassurance so that you can invest in Bitcoin with more confidence.
Everything in this post is based around technical analysis and statistics.
Finding the BottomWhile there is no one indicator that will magically tell you when the bottom has been made, however, by aligning multiple indicators together you can greatly increase your odds. There are a few indicators that I look for when determining the bottom of a price correction.
- RSI
- Support and Resistance
- Capitulation
A great place to start in identifying a bottom to Bitcoin's price movements is RSI, or relative strength index. Simply put, the relative strength index shows whether an asset is considered overbought or oversold based on speed and change of price movements. Anything above the value of 70 shows overbought conditions and anything below 30 shows oversold conditions. Throughout 2017, the RSI has called just about every single bottom before a major move up.
You can see on the chart below that every time Bitcoin has a correction, the RSI dips into oversold territory. If you would have bought at any dip near 30 on the RSI, you would have made money.
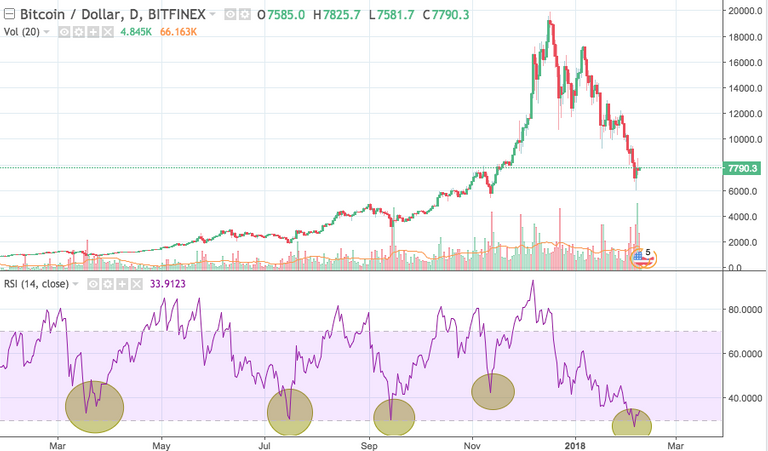
We are oversold now by looking at the chart, but it's better to combine multiple indicators to build a strong case rather than to go off of just one.
Support and ResistanceSupport and resistance lines provide an understanding of the psychology of other traders and investors. These lines form over time by price movements that seem to be unable to move above or below a certain price. What this tells us is that ultimately there are prices where the majority of investors will sell or buy. It's easier to show than to explain if you aren't familiar with this concept, so let me show you.
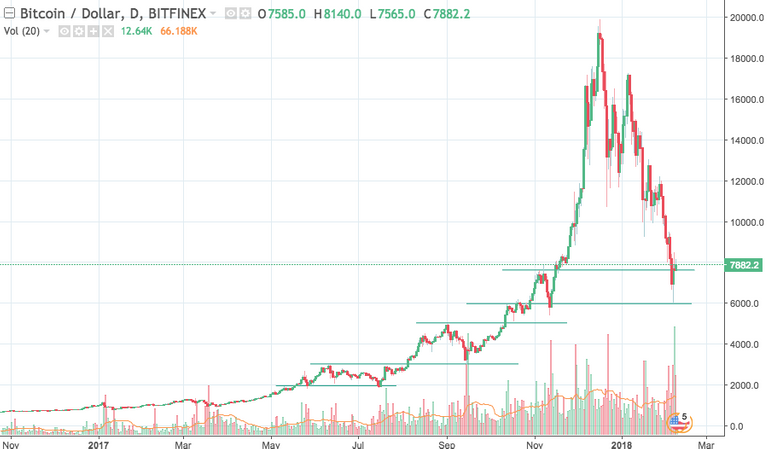
As you can see above, each price peak had a pullback that almost reached the previous peak. Resistance can easily become future support in a bull market and vice versa. We briefly touched a lower support line, but it looks to have held the price up and we are currently battling to hold the most recent support at around $7600. Support lines can make for great, low risk buys.
CapitulationThere is an event that happens every single time Bitcoin reaches a major price bottom, and it is called capitulation. This is where you will see a sharp decline in the price, met with massive relative trading volume. It is associated with panic selling, with the idea being that panic selling removes all the investors with "weak hands" and that everyone who wants to get out has gotten out. This word comes from a military term that means to surrender. Usually there are great deals to be had after panic selling. Check out the history in Bitcoin.
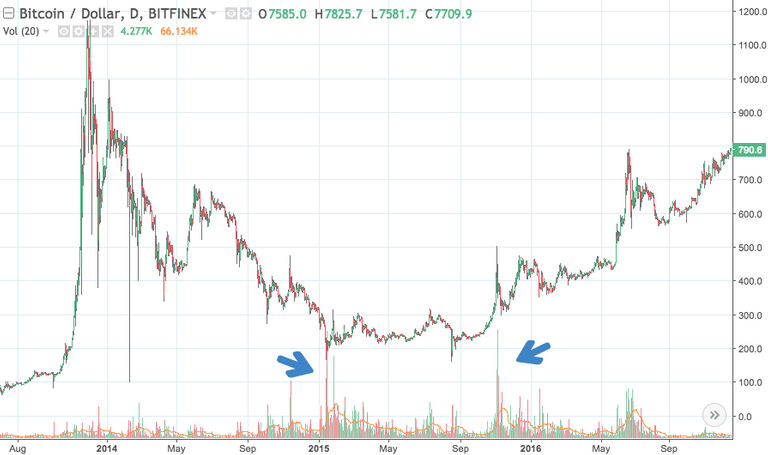
Back in 2014 this was an easy tell, as the price hit the bottom, there was a volume spike that dwarfed all previous 24hr volume. There was also another volume spike that signaled the new uptrend.
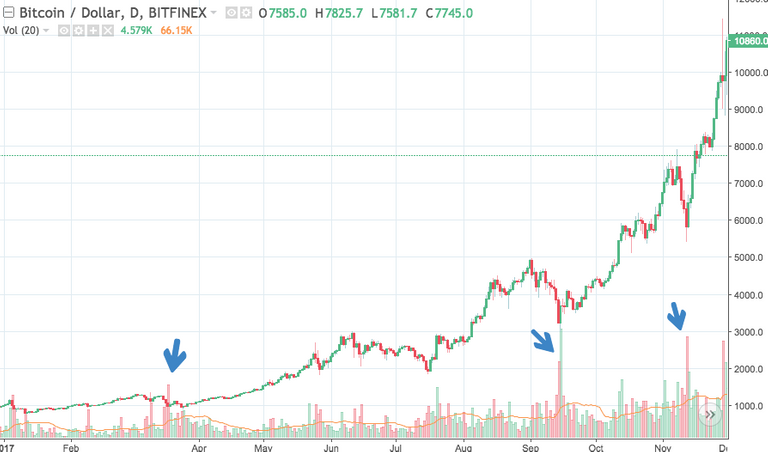
In 2017, you can see that every short-term bottom had a volume spike that was much larger that any during the uptrend.
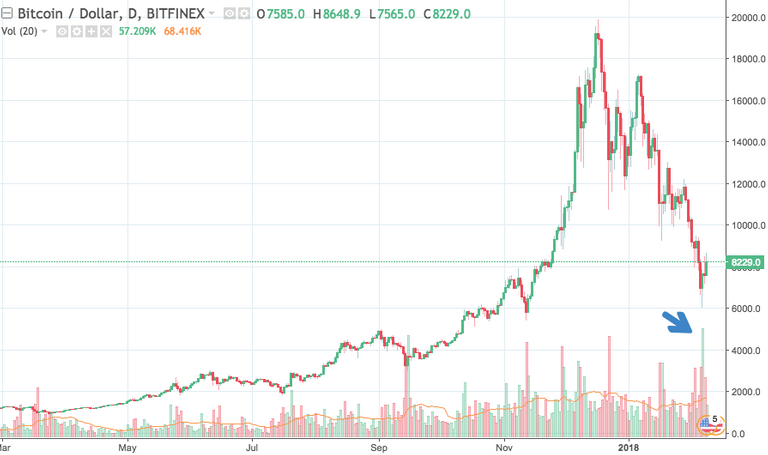
In the past few days, we did have a huge volume day that was larger than any previous day. Is this our capitulation day though? It's hard to say, it is a good sign in my eyes, but it doesn't dwarf the other 24hr volume bars like it has done in the past, so only time will tell.
To ConcludeAlthough technical analysis is a great tool, especially for cryptocurrencies, it doesn't give 100% certainty of an outcome. The goal of technical analysis is to put the odds in your favor by understanding statistics, so that you can profit in this crazy market.
Hopefully there are some things in this post that will be useful in your own investing. Always remember to do your own research and discover what works best for you.
Let me know what you think. Has Bitcoin seen it's bottom, or does it have further to go?
** I am a technical trader as well as a HODLer, I am not a financial advisor and do not provide buy or sell recommendations. Everything posted is opinion and for entertainment purposes.
Congratulations @bamtrades! You have completed some achievement on Steemit and have been rewarded with new badge(s) :
Click on any badge to view your own Board of Honor on SteemitBoard.
For more information about SteemitBoard, click here
If you no longer want to receive notifications, reply to this comment with the word
STOP