Hello and thank you for checking out my analysis, I really do appreciate it. Before I get started I also want to say I hope everyone has a great weekend, I know I am really looking forward to it here in Lakeside, Montana.
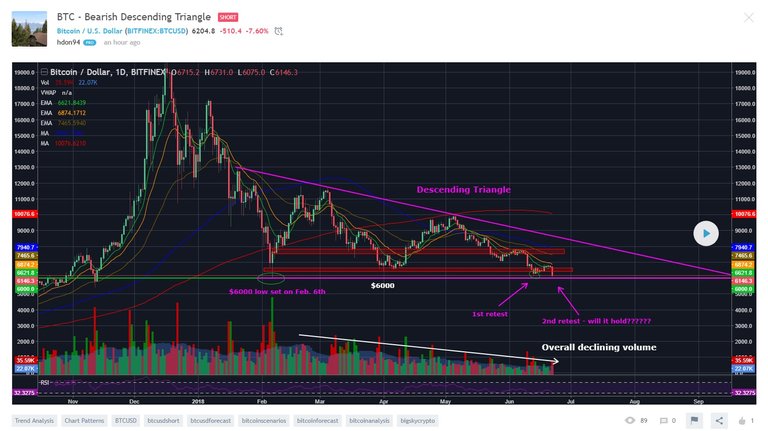
Okay, so BTC once again couldn't hold over the $6500 - $6600 resistance zone and is now retesting the $6000 level for the second time in a little over a week. For my chart this time I am looking at the daily time frame so that we can get a birds-eye view of the long-term pattern for BTC. You can also see that I have drawn in a descending triangle pattern, which for those of you who may not know is generally a bearish continuation pattern. So as a continuation pattern and because we are in a long-term down-trend the odds are that BTC will break down at some point through the bottom of the triangle.
If in fact, BTC does break through the bottom of the triangle at $6000 my feeling is that it will fall much farther, in my opinion, it will most likely also break below $5000. I posted charts months ago where I said I would not be surprised to see a bottom for BTC in the $2000 to $4000 area. Obviously, this is just my opinion and in the past, I have also posted possible alternative scenarios. One possible scenario is that $6000 is the bottom and that BTC now enters a consolidation phase trading in a channel may be between $6000 and $8000 which could last several months before the next bull market. Personally, I just don’t get the feeling that BTC is going to skyrocket to new all-time highs anytime soon. I would prefer to see a nice consolidation period followed by a gradual move higher, in my opinion, that would make for a much more stable market.
Here is a break down of a descending triangle from Stockcharts.com
Trend: In order to qualify as a continuation pattern, an established trend should exist. However, because the descending triangle is definitely a bearish pattern, the length and duration of the current trend is not as important. The robustness of the formation is paramount.
Lower Horizontal Line: At least 2 reaction lows are required to form the lower horizontal line. The lows do not have to be exact but should be within reasonable proximity of each other. There should be some distance separating the lows and a reaction high between them.
Upper Descending Trend Line: At least two reaction highs are required to form the upper descending trend line . These reaction highs should be successively lower and there should be some distance between the highs. If a more recent reaction high is equal to or greater than the previous reaction high, then the descending triangle is not valid.
Duration: The length of the pattern can range from a few weeks to many months, with the average pattern lasting from 1-3 months.
Volume: As the pattern develops, volume usually contracts. When the downside break occurs, there would ideally be an expansion of volume for confirmation. While volume confirmation is preferred, it is not always necessary.
Return to Breakout: A basic tenet of technical analysis is that broken support turns into resistance and vice versa. When the horizontal support line of the descending triangle is broken, it turns into resistance. Sometimes there will be a return to this newfound resistance level before the down move begins in earnest.
Target: Once the breakout has occurred, the price projection is found by measuring the widest distance of the pattern and subtracting it from the resistance breakout.
Hi! I am a robot. I just upvoted you! I found similar content that readers might be interested in:
http://stockcharts.com/school/doku.php?id=chart_school:chart_analysis:chart_patterns:descending_triangle_continuation