Bitcoin's (BTC) sharp recovery from two-week lows hit yesterday has raised the odds of a stronger rally towards $6,400, technical studies indicate.
As of writing, the leading cryptocurrency is changing hands at $6,245 on Bitfinex.
BTC was expected to drop below $6,000 in the last 24 hours as the bears were on the offensive following an inverted flag breakdown.
However, the intraday oversold conditions likely put a floor under bitcoin prices at the two-week low of $6,080, helping it chart a solid rebound to $6,283 (today's high).
While it is too early to call a bullish reversal, the change of fortune has saved the day for the BTC bulls. Moreover, the probability of BTC's price charting a picture-perfect inverse head-and-shoulders bullish reversal pattern would have dropped sharply had BTC found acceptance below $6,000.
Hourly chart 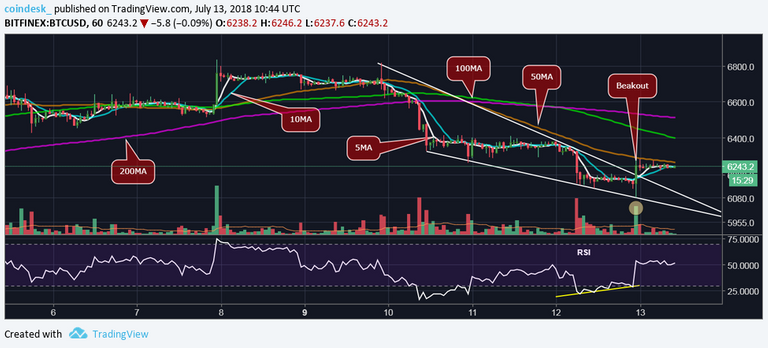 The above chart shows BTC created a falling wedge pattern over the last four days, as represented by lower highs and lower lows. Prices crossed the wedge resistance yesterday with strength (backed by a pick-up in volume), signaling the pullback from Monday's high of $6,820 has ended.
The falling wedge breakout also validated the bear-to-bull trend change indicated by the bullish price-relative strength index divergence (higher low on the RSI).
So, BTC will likely find acceptance above the immediate resistance $6,270 (50-hour moving average) and rise towards the descending 100-hour MA, currently located at $6,404.
While the hourly chart has adopted a bullish bias, the daily chart is still biased to the bears, so the bulls are cautioned against being too ambitious.
Daily chart 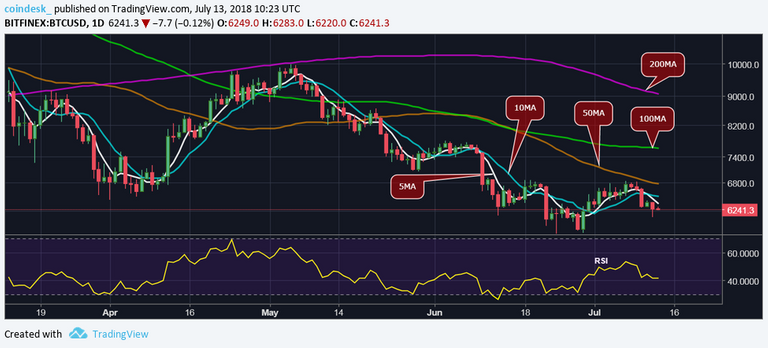
The 5-day and 10-day MA are trending south, implying a bearish bias, while the relative strength index (RSI) is holding below 50.00, also indicating the bears are in control.
View
BTC could attack the $6,400 mark, but further gains are ruled out for now as the descending (bearish) 5-day MA and 10-day MA are located at $6,366 and $6,500, respectively.
That said, if BTC manages to close (as per UTC) today above 10-day MA, then the doors would open for a re-test of the Monday's high of $6,820.
Bearish scenario: A failure to produce a significant move higher despite the bullish price RSI divergence and the falling wedge breakout would shift risk in favor of a drop to a recent low of $5,755. The downside move will likely gather pace if BTC fails to hold above $6,080 (previous day's high) over the weekend.
Source
Plagiarism is the copying & pasting of others work without giving credit to the original author or artist. Plagiarized posts are considered spam.
Spam is discouraged by the community, and may result in action from the cheetah bot.
More information and tips on sharing content.
If you believe this comment is in error, please contact us in #disputes on Discord
Hi! I am a robot. I just upvoted you! I found similar content that readers might be interested in:
https://dollardestruction.com/8148/
thanks for your compliment
thanks for the info
welcome @lagtv