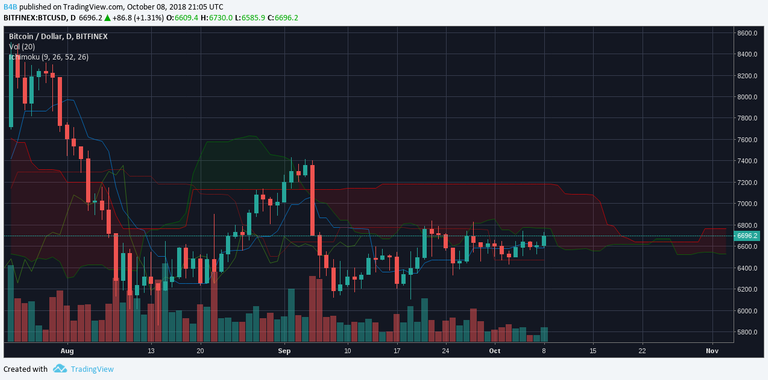
Ichimoku cloud on the daily chart indicates resistance. The price crossed the ichimoku cloud several times since January, but fell back below it each time. If we don't see a bullish breakout this month, the bearish trend may continue or even gain momentum in November.
Disclaimer: I am not a financial advisor. The crypto market is very volatile, make your own conclusions and invest at your own risk.