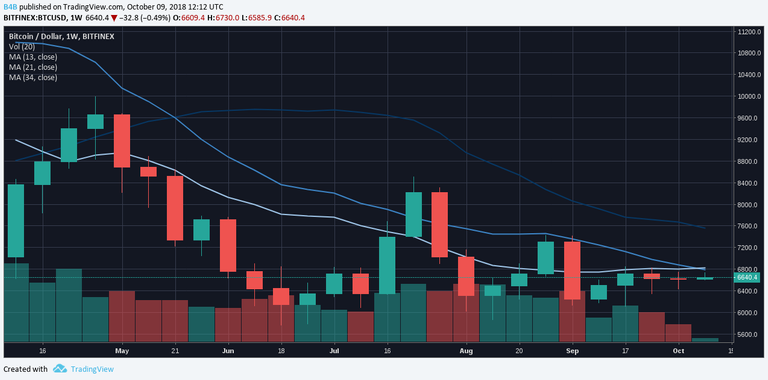
Simple moving averages on the weekly chart using fibonacci numbers 13, 21, 34 show a formidable resistance near the 7k level. It will be not easy to break through this resistance. A whale buying in or a very encouraging news would help in this case. Once the price breaks through the resistance and manages to stay above they will act as a support for a possible mid-term rally. If not, price might be pushed below the 6k support level and the bear market will gain momentum again.
Disclaimer: I am not a financial advisor. The crypto market is very volatile, make your own conclusions and invest at your own risk.