Bitcoin is currently correcting higher from the $7,638 monthly low against the US Dollar. BTC price could correct higher towards the $8,200 resistance area, where the bears are likely to appear.
Bitcoin is showing a few recovery signs above the $7,800 level against the US Dollar.
The price is currently forming a rounding pattern, which could lead the price towards $8,200.
There was a break above a declining channel with resistance near $7,800 on the hourly chart of the BTC/USD pair (data feed from Kraken).
The pair is likely to face a strong selling interest near the $8,200 and $8,220 levels.
Bitcoin Sighting Short Term Recovery
In the past few sessions, there was a sharp decline in bitcoin from well above the $8,200 level against the US Dollar. BTC price even broke the $8,000 support level and settled well below the 100 hourly simple moving average.
A new monthly low is formed near $7,638 and the price is currently correcting higher. It surpassed the $7,800 and $7,850 resistance levels. More importantly, there was a break above a declining channel with resistance near $7,800 on the hourly chart of the BTC/USD pair.
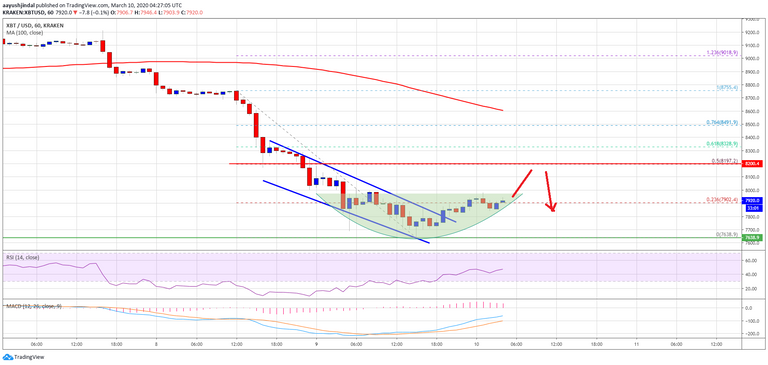
The pair is now trading just above the 23.6% Fib retracement level of the recent drop from the $8,755 high to $7,638 low. It seems like bitcoin is forming a rounding bottom pattern, which might spark a short term recovery.
The pattern resistance is near the $7,980 and $8,000 levels. A successful break above the $8,000 resistance is likely to send the price towards the main $8,200 resistance level, where the bears are waiting.
The 50% Fib retracement level of the recent drop from the $8,755 high to $7,638 low is also near the $8,200 area to act as a major hurdle for the bulls. Therefore, the price must settle above $8,200 to start a fresh increase towards the $8,500 and $8,650 levels.
Chances of More Losses
On the upside, bitcoin is facing two key resistances – $8,000 and $8,200. If it fails to clear either of them, there is a risk of more losses below the $7,800 level.
An initial support is near the $7,640 level, below which the bears are likely to aim a test of the main $7,500 support area (as discussed in yesterday’s analysis using the daily chart).
Technical indicators:
Hourly MACD – The MACD is now moving slowly in the bullish zone.
Hourly RSI (Relative Strength Index) – The RSI for BTC/USD is likely to move above the 50 level.
Major Support Levels – $7,800 followed by $7,640.
Major Resistance Levels – $8,000, $8,200 and $8,500.
Source
Plagiarism is the copying & pasting of others work without giving credit to the original author or artist. Plagiarized posts are considered fraud and violate the intellectual property rights of the original creator.
Fraud is discouraged by the community and may result in the account being Blacklisted.
If you believe this comment is in error, please contact us in #disputes on Discord