The EMA--or Exponential Moving Average--is an indicator in technical analysis that averages the price of an asset over a given number of trading periods. Its purpose is to show a less emotional view of the market's trend, which is relevant in times of overheated, or over-feared markets.
As with all technical analysis indicators the EMA should be taken with a grain of salt.
I find certain markets respond better to certain indicators. Sometimes for unexplainable reasons. The key to successful trading is finding which technical patterns a given market is responding to, and give more weight to those patterns when deciding trades.
In the case of Bitcoin, the respect and draw it has shown to the 150EMA has been remarkable. See the chart below:
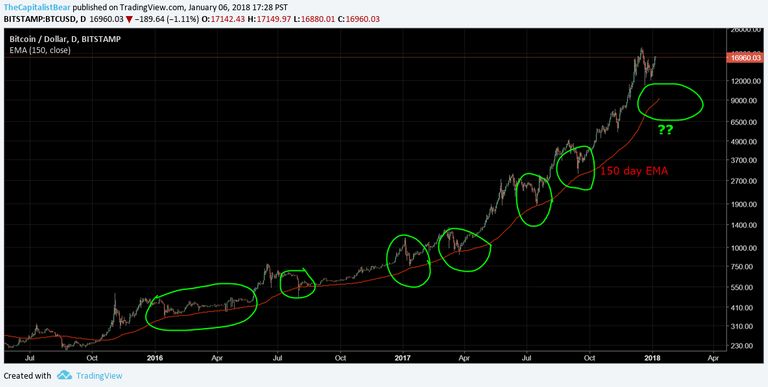
Since early 2016, Bitcoin has bounced off the 150 day EMA approximately 6 times (depending how you count).
As a breakout occurs, the price strays away from its average. In order to be sustainable it must "revert to the mean".
I'm of the opinion that Bitcoin hasn't completely reverted to the mean yet, especially when comparing its past consistency of doing so!
This means this correction in Bitcoin likely isn't over. It needs more correction in price, time, or a combination of both before potentially resuming uptrend.
Disclaimer: Past performance does not guarantee future results. This is not a trading recommendation and you should not use it to bet money. It's simply an objective application of technical analysis for your learning. Crypto trading is high risk, you could lose everything!
Hi @bodaggin, Very interesting analysis using only the RSI! The last touch of the RSI was during August, You would have expected a more violent drop when It hit $6500 but it didn't,this was when the mass media adoption and Bull sentiment of Bitcoin kept the price up. I don't think the growth stage of Bitcoin is over yet and I do think until we hit the 30-45k mark, we won't be touching the RSI Line again.
We are expecting a 50% violent drop from 38-45k. If it does indeed hit those levels, I believe we'll see the -20k mark again, at that point touching the RSI line during June July of this year.
That's just my thoughts, I think your analysis idea is correct, but I don't agree with your predictions, anyway time will tell! Thankyou for this alternate view!
Cheers ~
Hi @synco. Above is actually the EMA Exponential Moving Average, or moving average. It averages the price of a security over a given number of days, in this case 150.
RSI is an oscillator you will find on the bottom of a chart (like volume), and RSI aims to show overbought and oversold conditions.
Best of luck on your journey with TA.
Oh wow, hahaha, I guess I can only laugh at myself now... well, you know what I meant and thank you! :D