I used to check BTC daily charts for entry and exit decisions. Since last few days, it seems too lazy to check BTC for entries and exits over one day. I think BTC trading decisions can be done profitably looking at 30 min to 1 hour charts…laziest 4 hours max.
In this notes, however, I am analyzing BTC daily charts and 4 day charts. From my analysis, I think BTC is not a buy, may be a hold or a sell!
a)If I was in profit with BTC, I would sell.
b)If I was in loss with BTC, I would hold for now(Time: 21:00 UTC) until tomorrow with stop loss of course. My stoplosses would be probably divided into 11 unequal portions from my highest exit price to my lowest exit price.
The Screenshot of BTCUSD(coinbase) daily chart :
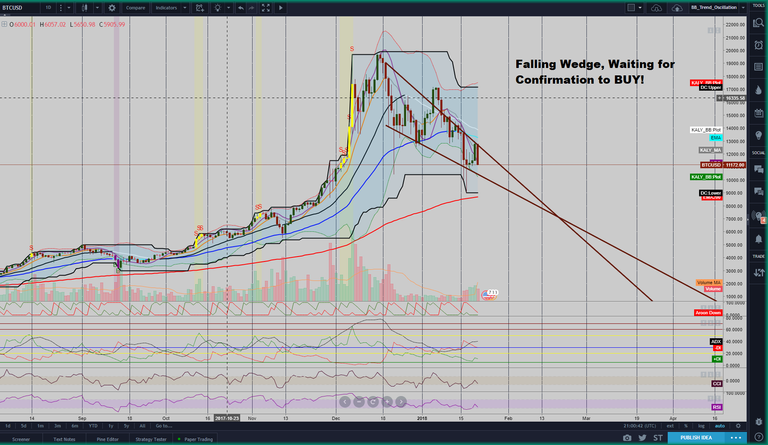
Here,
- Today appears to be forming a perfect bearish tweezer top along with yesterday(UTC time). Please note that as this pattern is occurring in a downtrend, the candles(price) have a greater probability of slipping down.
- Hanging on down-trending 9 day Moving Average(9MA) (gray line)
- Today’s Red candle stretched back to down-trending linear regression line(pink line)
- 20MA(white line) is reaching towards 50EMA(teal colored line)
- on Bollinger Bands, the price appears to have bounced on the lower band and going back which is more loss-bleeding/bearish than if the price just slid down along the long band.
- negative momentum on MACD, RSI
- Money Flow Indicator(MFI10) 10 periods shows some divergence giving support to the idea that the falling wedge may be bullish
- downtrend on ADX10 periods
- Though OBV, CMF and UO are falling, they are showing some resiliance giving support to the idea that the falling wedge may be bullish
The Screenshot of BTCUSD(coinbase) 4 day chart :
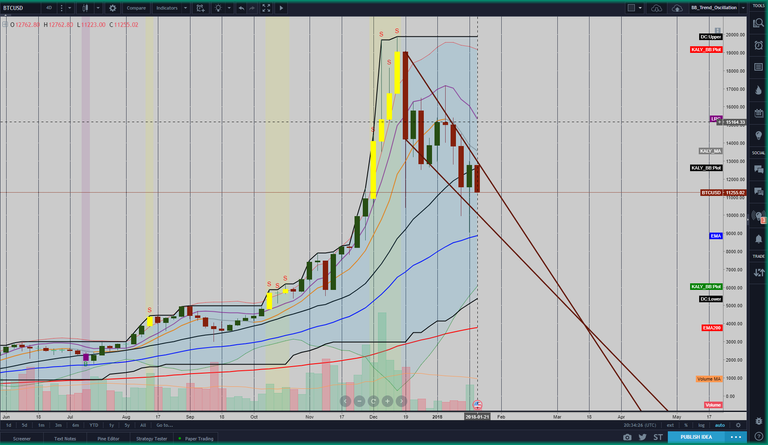
- Bullish Falling Wedge…Wonder how low will it go? (I’m guessing as far as 50 period EMA(blue line))
- 9 period MA(gray line) and 20 period linear regression line are parallel to each other and going towards 20 period MA(black line) which appears to be a 4 day trend reversal
- ADX10 periods showing trend indecision(no trend) but the red DI line coming up in steps shows bearish trend could continue for few more periods.
- RSI14 appears to be trending down…now near 40
- CCI 10 periods is already lower than -100 indicating continuation of down trend.
- MACD is bearish
- OBV and UO(Ultimate Oscillators) are trailing down
- Money Flow(10) is trailing down
Therefore, I think BTC is not a buy, may be a hold or a sell as of today(Time: 21:00 UTC)!…Please let me know what you think!
More Details will follow as time permits. Please let me know if I am missing anything…..
Legal Disclaimer: I am not bribed to write here and I am not seeking insider favors. I wrote here so I get replies from fellow viewers to educate myself and for my daily expenses. Hence, if anyone uses this post for making their decisions, I am not responsible for any failures incurred.
Safe Trading!
Kal Gandikota
PS: If you found this blog post interesting and edifying please follow, upvote, resteem.
PS2: Please kindly donate for my daily expenses (atleast as you would on streets) at the following addresses:
SteemID - chipmaker
BTS Wallet - chip-maker
ETH Wallet - 0x0450DCB7d4084c6cc6967584263cF6fBebA761D1
NEO Wallet - AUdiNJDW7boeUyYYNhX86p2T8eWwuELSGr

PS3: To open a cryptocurrency trading account, please kindly use the following website where I trade most:
https://www.binance.com/?ref=18571297