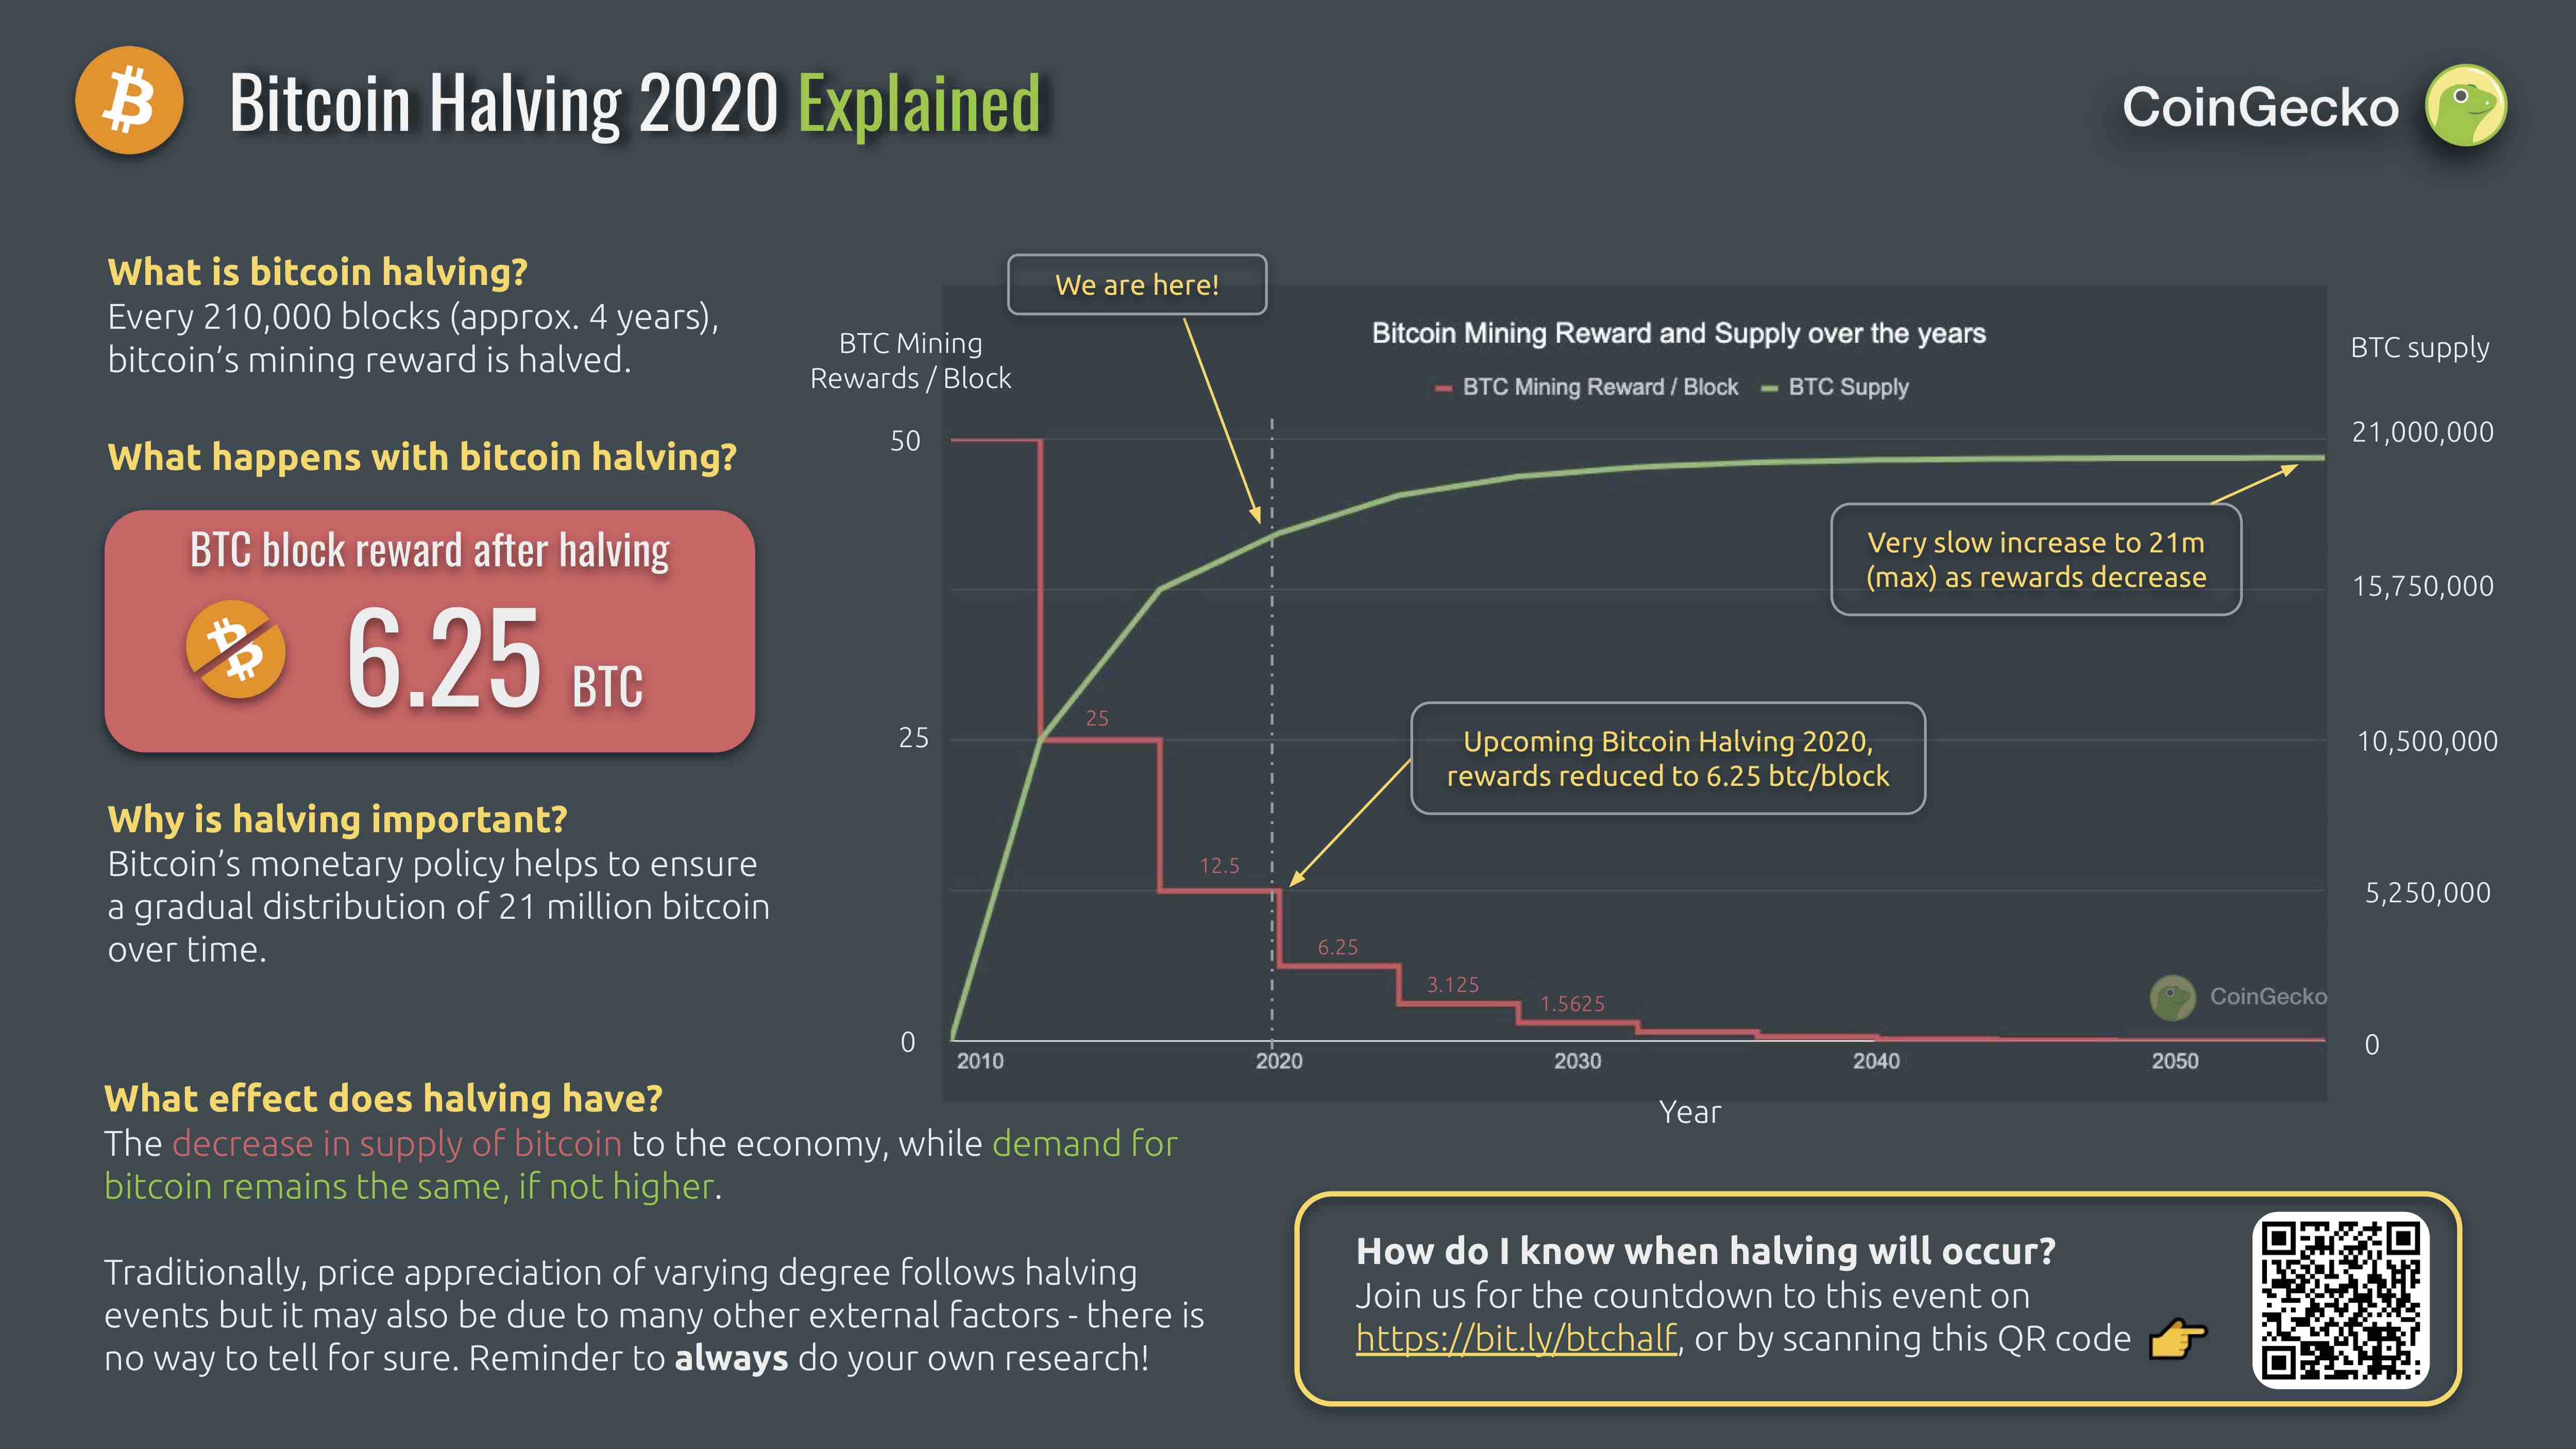
We have published an infographic that explains bitcoin halving in a single graphic.
The next time you need to explain the halving event to someone, just send them this!

Meanwhile bitcoin price has hit $9,548 at the time of writing according to our cryptocurrency price tracker
Great infographic, I think a lot of BTC holders don't even know this is happening and its going to take a lot of people by surprise
As a BTC holder, actually it would not directly affect them too much. The amount of BTC you hold dont change and the percentage of BTC you hold vs the total supply don't either.
However, as you suggested, it is true that many do not understand the ramification of a supply decrease event especially doubled with the worst quantitative easing event happening the financial space.
There will also be unintended consequences of each year people lose their BTC, Forget it especially new holders who come into the market, reducing the supply forever.
Its quite interesting to see people buy in now that know about the halving, as they're moving the price up to set a floor for miners who will capitulate over the coming weeks and allow time for the new stock to flow model to run its course, its amazing how Satoshi thought of all of this, or if it was just that he knew human behaviour so well
Superb explanation, thank you.
Nerdy graphic design question:
Shouldn’t the x-axis be ticked in four-year increments rather than ten-year?
Yup i think that illustrates the halving period well too
Thank you for the infographic!