What do you think of when you hear the word “trading”? A desk with 8+ monitors, a huge phone-board and a cocaine sniffing, adrenaline junkie trader? If you couple that with the abundance of trading related material out there, it’s easy to see why one can feel overwhelmed by the “complexity” of trading.

The general perception is that traders must be all knowing… they should look at all the charts, analyse all the indicators and read all the news that’s out there. This couldn’t be further from the truth! As shockingly obvious as it sounds, you should pay attention only to the stuff that’s actually relevant. What’s even more shocking, is how many people manage to get this simple concept wrong!
Retail investors generally believe that if they open good charting software and overlay a bunch of indicators, they will be ready to make a killing for themselves in the market. What will come as a surprise to them, is that the pros (the institutional traders that actually make a killing for themselves) don’t rely on charts or indicators. Sure, they can be used as supplementary tools to get a sense of the market, but at the end of the day, charts are nothing more than merely a trail of prices, and indicators generally lag behind price action. By relying on these tools, a trader can only hope to catch the tails of large market moves.
So what do the pros do? What relevant information do they look at? Fortunately, to answer this question you don’t have to go very far... a simple Google image search for “prop trading” will give you all the insight you need.

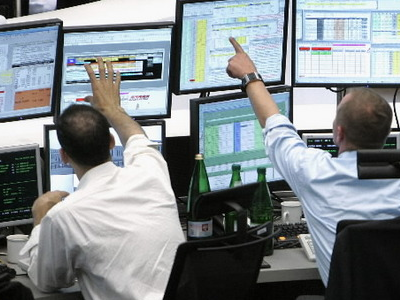
Look at the images closely, and try focus on the institutional desk setups that are in a real office and not in some amateur’s basement. You will see that their monitors are crammed with all sorts of raw data: Level II quotes, volume profiles and Time & Sales tapes. The key point here is that all three of these tools, in one form or another, are a representation of the market volume. So yes, volume speaks volumes!
Price vs Volume
The correct way to think about this is not actually in “vs” terms, but in the way price and volume complement each other. Price charts may be a useful tool for identifying potential areas of support and resistance, but it’s the volume that gives any significance to those levels. Volume can add a whole new dimension to the story that’s being told by the market.
For example, let’s say that a currency has a huge up bar while approaching a previous peak. Just by looking at a price chart, one can easily conclude that due to the size of the bar up, the buyers are aggressive and will probably move higher past the previous peak. Now consider how different volume scenarios can either support or reject this view.
a. The move up was on extremely low volume, and Level II quotes show large offers at the previous peak level – First, the fact that the move happened on extremely low volume suggests that the market at these prices was not very liquid and therefore it did not take a lot of effort to push the price up. Thus, the buyers might not necessarily be as aggressive as the charts make them out to be. Second, the fact that Level II quotes show a lot of offers at the previous peak level suggests there will be a lot of resistance in that area. Also, the sellers might be willing to aggressively defend the peak if the price goes any higher. In conclusion, a lot of resistance at the peak coupled with a potentially not so aggressive herd of buyers, smells more like market reversal rather that a break out (as inferred from a simple price chart).
b. The move up was on high volume, the T&S tape shows that most of the trades are by buyers who lifted market orders , and Level II quotes show large offers at the previous peak level – First, the fact that the move happened on high volume suggests that there was a reasonable amount of resistance, however, the buyers still managed to push higher, suggesting that they are aggressive. This aggression is also emphasized by the fact the T&S tape showed that most of the trades where the result of buyers lifting market offers and the passive sellers being unwilling to aggressively defend their shorts. Second, the fact that Level II quotes show a lot of offers is less significant in this case as the buyers are aggressive and well capable of absorbing the offers on their way up. In conclusion, the move towards the previous peak is driven by buyer aggression, and unless the sellers will counter them with an equal amount of resistance/aggression, the market will probably break out higher.
The above is obviously a simple example, but nevertheless demonstrates the advantages of incorporating volume analysis into a trading strategy.
The Bottom Line
If you want to be a pro, you have to behave like a pro. That doesn’t necessarily mean that you have to incorporate everything they do into your strategy, but at least being aware of what they look at will give you a huge advantage. Having said that though, each market is different and has its own specificities, so any form of volume analysis has to be tailored to that specific market and to the way participants behave in it.
I will be covering the various volume analysis tools and strategies in greater detail in some of my later posts, so if you’re interested be sure to follow 😊
Good info. Better to be watching what is happening instead of what already happened. I'd better spend more time watching Volume and the likelihood of what it means. Thanks for sharing.