
Where can see on a naked price below that Bitcoin has been in a down trend. Yes, there has been a resurgence over the last week, however the trend is still BEARISH.
Firstly, take a look at the RSI levels which have been overbought twice on the chart below.
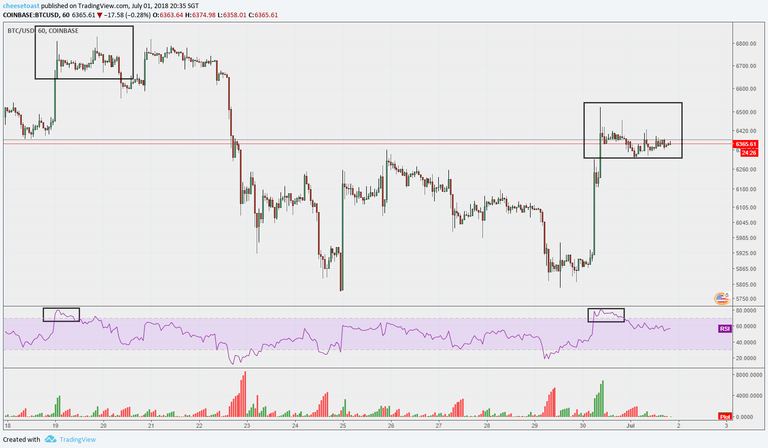
The last time the RSI was overbought over 70 points was on the the 19th of June when Bitcoin rose to of $6,823.
Only to fall approximately 15% in just over 5 days.
If you turn your attention to the Bitcoin chart in the last few days, the RSI is overbought once again. So what does this mean?
Nothing really.
Let's take a closer look on the 30 minute chart.
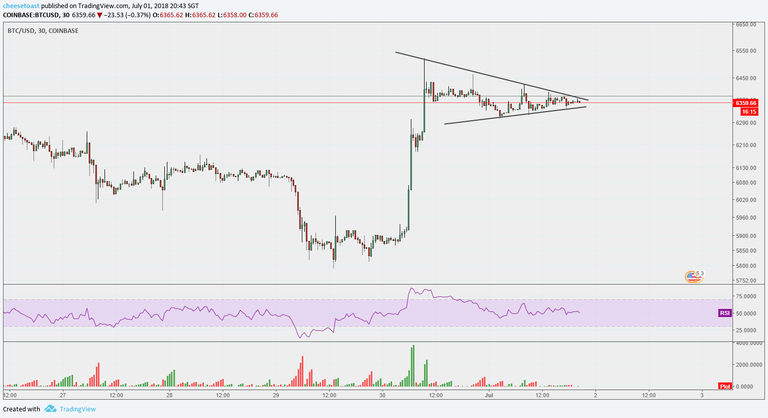
We can now see that Bitcoin is starting to coil after a resurgence from the recent lows near $5,800. This is often called a pennant formation which will typical break out with strong momentum in a direction, after a period of consolidation.
So which way will Bitcoin breakout? That is the golden question.
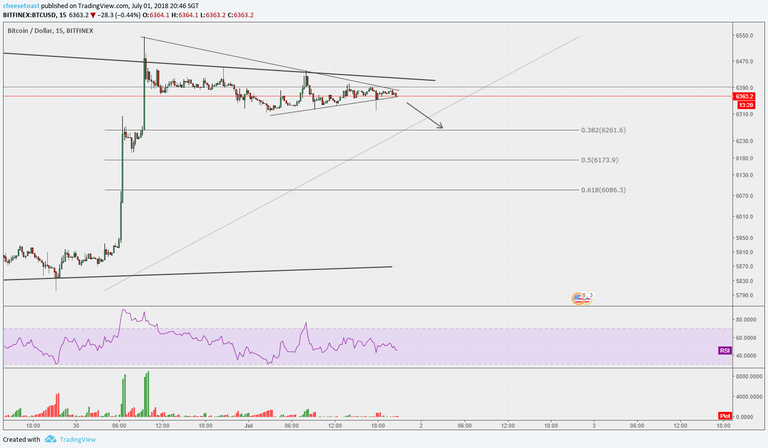
Let me be totally honest, I do not know which direction it will breakout.
But I am willing to risk a percentage of my account with a clear exit, take profit level and favorable odds. And that is trend continuation to resume on the break of a smaller time frame pattern. My trade analysis is shown below.
Mr. Soros once said:
“It’s not whether you’re right or wrong that’s important, but how much money you make when you’re right and how much you lose when you‘re wrong.”

Congratulations @crypto-toast! You received a personal award!
You can view your badges on your Steem Board and compare to others on the Steem Ranking
Do not miss the last post from @steemitboard:
Vote for @Steemitboard as a witness to get one more award and increased upvotes!