Hi all,
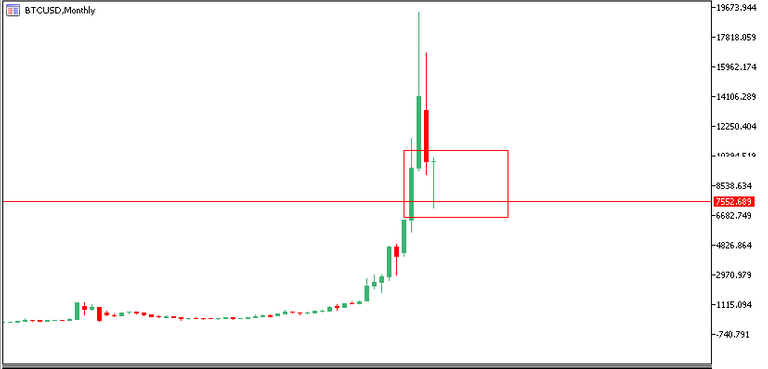
Analysis on BTC today is showing some interesting signs. While the monthly shows us a huge bullish pin bar, the daily chart shows us a descending wedge.
So what does it mean?
Well, as of right now this monthly Pin bar is yet to close and the Bullish signal will not be confirmed unless it holds the price it is at now, or higher when the bar does close on the 28/2/2018 so we will be watching this closely!
On the shorter term, BTC is on the top of the descending wedge, and rules of trading triangles states that 85% of the time there are 3 touches of a wedge bottom (in a downtrend) before a break out will be seen. As you can see below we are on the second touch only.
With the huge rejection of $7500 showing on the monthly chart, and the descending wedge looking to be coming to its end we are still holding, however not yet buying more until we see price come down into the green rectangle BUY ZONE we see below between $6600-$7500.
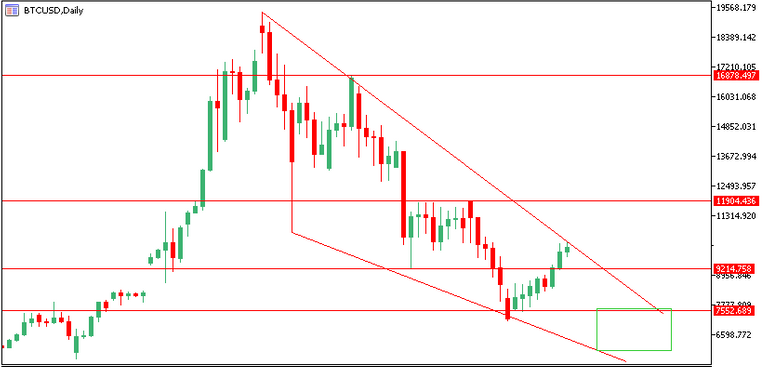
This buy zone is based on multiple indications and looks to be the most technically logical place to be accumulating more BTC, and once this price is hit, we will be buying more and HODL as always.
Happy trading!
Sam Broye