Bitcoin Price Analysis: Yeah, I’m Still Bearish
So there were a lot of people that were telling me, “Man, you said that this thing was going to $8.2k max! You were completely wrong! You took out the dumbest short of all time!”
So, short-sighted my young grasshopper.
Before I even go into this article, I have to tell everyone out there that price is never linear.
That’s what kills day traders the most. They invest in something (long) and then they set a target in their head. Let’s say their target is $40. The price is $30 right now.
All of a sudden, the price goes to $28 or even $26.
You know what amateur traders would do in this situation?
“Oh no, the price has went down, so clearly I was wrong about my pick.”
That statement that I just made above is based on a really common fallacy in the crypto trading community in specific.
There is No Right or Wrong
This concept of being ‘right’ or ‘wrong’ doesn’t exist in trading.
The only thing that actually matters is how you manage a trade.
Here’s a scenario:
You could buy something at $10 and it may go up to $15 before plummeting back down to $5.
Depending on how that trade played, both the long and short trader could have come out ahead in the above scenario.
So, when people say,
“But Med, you said that you felt it was good to pull at $7.6k, you were wrong!”
No. My strategy is just different.
Now, if the price never goes back down below $7.6k, then yeah, I fucked up.
But if I grab this back down in the $6,000’s somewhere, I eat.
And based on where Bitcoin was in price at $7.6k, I knew the gains on the short was more likely to be bigger than the gain on the long.
And to this point, I think that is still true.
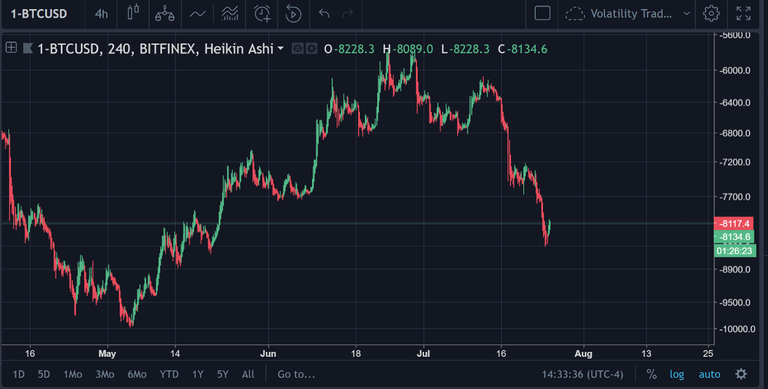
Bitcoin Price Analysis
So, without further ado.
Let’s check out an inverse price chart (this is where the price of Bitcoin actually becomes inverted on the TradingView chart)
Here’s the Inverse Chart
Why the Inverse?
Because our minds are typically biased toward the price going upward, so we tend to rule out a lot of bearish possibilities.
Thus, in a lot of ways, this confronts our implicit biases and at times allows us to see things that we normally wouldn’t see.
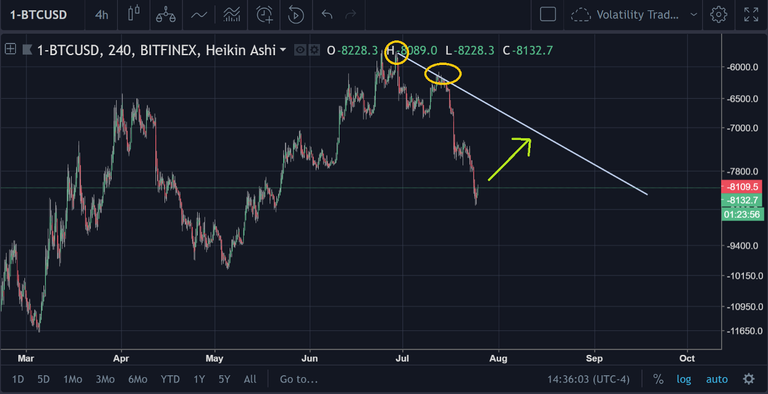
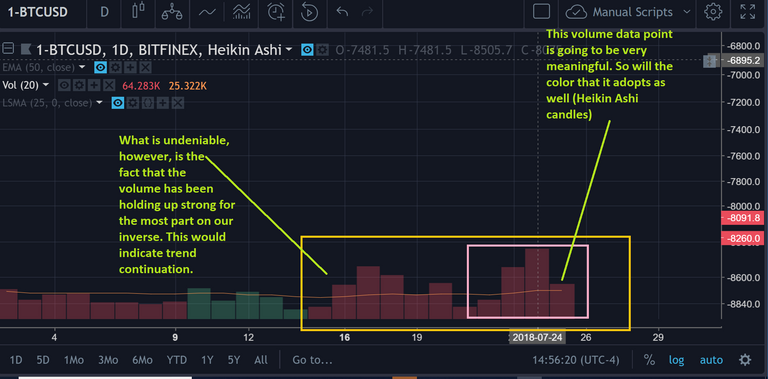
So, on the inverse chart, we can see this clear “downtrend” that has occurred since June 28th.
Common sense and trading logic tells us that the price should be ready to move back toward that line as well.

So, the target here on this inverse chart appears to be $6.8k-$7k ish from what I'm seeing.
Relative Strength Index
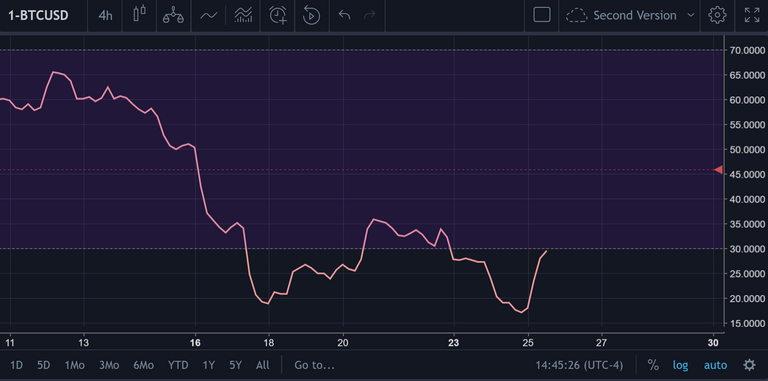
You're lying to yourself if you say that the RSI on the inverse BTC chart doesn't look like a delectable entry (short in this case, if we inverse the inverse to get to a 'normal' chart).
Bollinger's Bands

It's hard to say that there won't at least be some sort of bounce (inverse) on the Bollinger's from the look that we're getting on the 4H inverse.
Exponential Moving Averages
For this portion of the analysis, I only like looking at the EMA-50 specifically

That blue line = EMA-50, which is standing at $7k on the daily chart (for the inverse).
That means that it will serve as "resistance" as the price moves upward on our inverse.
Volume
The EMA-100 and EMA-200, are hovering at $7.8k and $7.4k, respectively.
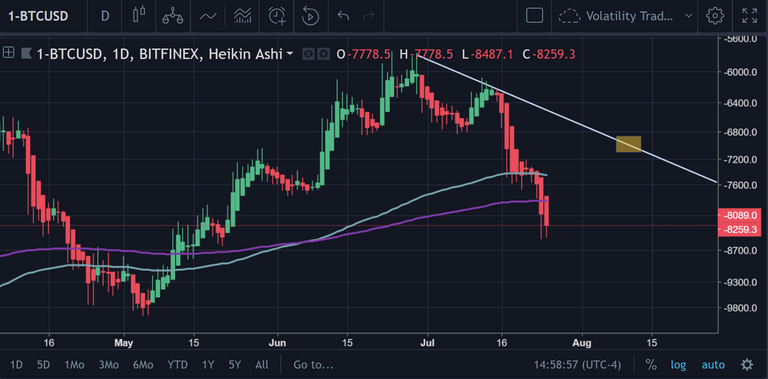
Purple line = EMA-100
Light Blue Line = EMA-200
Conclusion
I hope what I have posted here thus far has made it abundantly clear how important it is to value the inverse chart in order to control for the latent biases that one may have for positive price action.
It's hard to look at the indicators and price movement on Bitcoin (on an inverse), and justify why there would not be a move up (i.e., a move down on the regular charts) in the near future.
For just about any trader, this looks as though this would be a great entry point.
So, why would you not consider it the perfect short?
It appears that there is a lot of short-term trader bias that is distracting people from seeing what appears to be the obvious.
I'm not much of a fan for a short idea, but I definitely see your points. I don't think the price will pump either drastically, I would be more than happy to just know the price can move sideways and remain stable and healthy but we know no one likes that. We need to see a drastic dip to even consider a pump for a long. With the RSI, I think is too far fetched to invert it, and think that looks like a short. I would never short an overbought RSI because is precisely showing you the strength of the price move. And on top you're taking the 4h RSI in consideration, that to me deserves your own quote "short-sighted my young grasshopper."