Double-Bottom Pattern
Like its counterpart, the double top— the double bottom works in a very similar way.
The double bottom reversal pattern appears as follows:
Essentially, the double bottom formation is one of the more common ones that you’ll run into as far as reversal patterns are concerned. It’s a bullish chart formation, which means that it typically indicates that there will be a reversal from a downtrend in the price to an uptrend.
To quote another authoritative source, “The double bottom pattern always follows a major or minor down trend in a particular security, and signals the reversal and the beginning of a potential uptrend. Consequently, the pattern should be validated by market fundamentals for the security itself, as well as the sector that the security belongs to, and the market in general.” — https://www.investopedia.com/terms/d/doublebottom.asp?lgl=rira-layout
Note the two bottoms on the chart posted below:
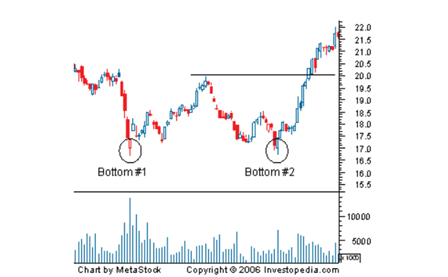
As with double tops, the bottoms do not need to hit the same value on the support. Along as they are approximately near each other, they can be considered to be ‘double bottoms’.
In order to accurately identify a chart pattern as a double bottom, a set of criteria must be met first (I adopted this criteria format from the website (http://stockcharts.com/school/doku.php?id=chart_school:chart_analysis:chart_patterns:double_bottom_reversalbut the wording is different):
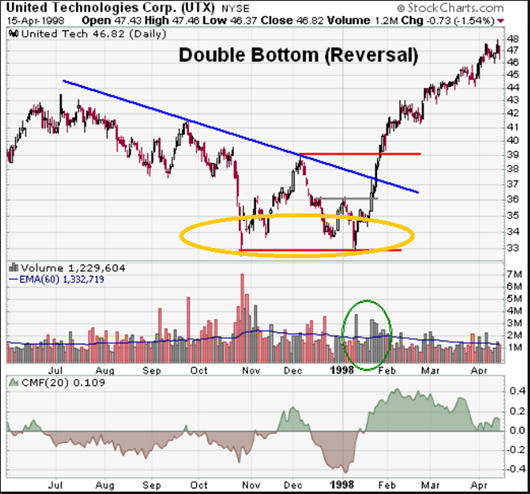
- Prior Trend — There must have been a prior downward trend that was present before the occurrence of the double bottom. Otherwise, the pattern cannot be deemed valid. Below example of a downward trend:

- ‘First Bottom’ — This portion is established at the point that the price informally breaks its downtrend to ascend.
See the graphic below to get a better idea of what I mean here when I state this (picture derived from http://forextraininggroup.com/trade-double-top-bottom-reversal-patterns/):
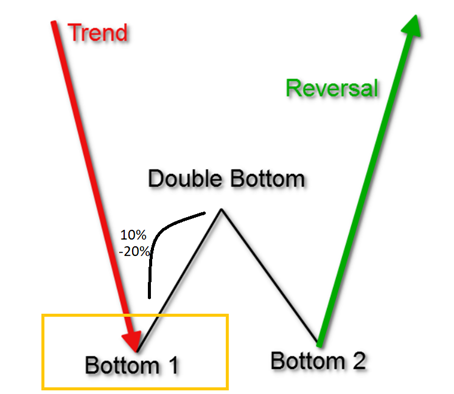
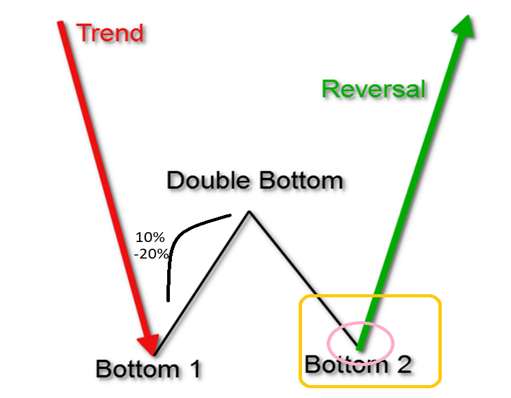
- Peak — This is peak price that the stock/crypto reaches after the brief informal break in the downtrend. It is represented by the ‘Double Bottom’ label on the infographic. “Most technical analysts believe that the advance of the first bottom should be 10 to 20%. The second bottom should form within 3 to 4% of the previous low, and volume on the ensuing advance should increase” (https://www.investopedia.com/terms/d/doublebottom.asp?lgl=rira-layout).
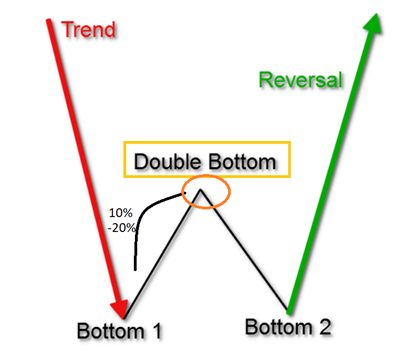
- Bottom #2 — This is defined as the point that the price returns to after hitting the ‘Double Bottom’ point. This may be the most important defining characteristic of determining whether a chart possesses a double bottom pattern or not. In order to qualify as a ‘double bottom’, the conditions in #1, #2, and #3 on the list must be met and the second bottom must be approximately at the same spot as the first bottom before the price begins to increase once again.
If this does not happen, then the chart pattern cannot be deemed to be a true double bottom. See the picture below:
How to Trade the Double Bottom
Similar to the Double Top, the Double Bottom should not be traded until after the second bottom has been established and price has once again surpassed the price of the double bottom point. Check out the illustration below for a visual of what I’m talking about:
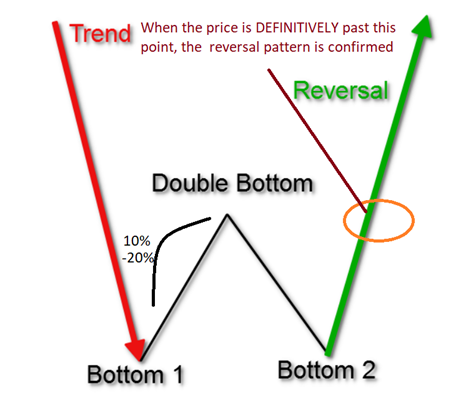
If you’re someone that prefers to set a stop-loss (I’m not into it), then you should set the stop loss at the price at where the ‘Double Bottom’ label is on the chart above.