In-Depth Bitcoin Historical Analysis That May Provide the Answer for What Comes Next

This endeavor started with me just putting up some price charts in my Telegram channel and noting some observations.
Then, I started to take a closer look and notice some distinct patterns and phases via technical analysis that Bitcoin has went through.
After making these discoveries, I feel more convicted than ever before that my findings may shed light on the potential price action of Bitcoin in the “long-term”.
Disclaimer: This is not financial advice.
Introduction
I used this site here: https://99bitcoins.com/price-chart-history/
Along with TradingView as my frame of reference for the price analysis that you’ll see below.
This https://99bitcoins.com/price-chart-history/ link is useful because it provides accurate price information on Bitcoin (from Mt. Gox) dating back to 2010. Which is exactly what we need.
Not Looking at Fundamental Analysis Here
I’m only interested in the price information though, not the fundamental analysis because times are entirely differtent now.
We already know that Bitcoin is pretty much legitimate. It has some outspoken critics, but for the most part we’re way beyond arguing whether this should be considered ‘money’ or not.
I think the vast majority of people that know what Bitcoin is would be more than happy to accept a Bitcoin from you if you offered them one.
Starting With 2011

I started off with this peak here on June 9th 2011; Price of Bitcoin was $29.58
Mt. Gox still dominating the scene. Price started off on Gox at $0.05 in early 2010. Considerable increase before this first top that Bitcoin experienced.
What I took note of though is that the vast majority of the price movement occurred in the few months prior to that top.
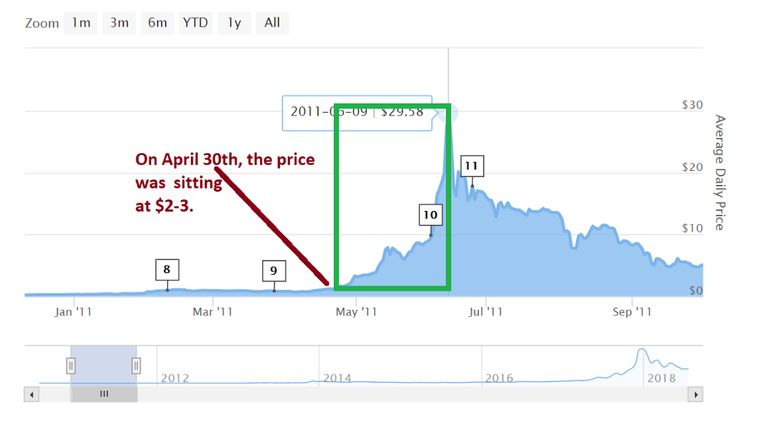
On April 30th, 2011 the price was hovering at $2-$3/Bitcoin. Which represented a solid gain for the year already at that point.
But from that period all the way to June 9th, 2011 (really in the space of a little over a month) the price increased 800%+.
Obviously, this led to a blow-off top.
The First Real Bitcoin Bear Market (2011)

Just 5 months later, on November 18th, 2011 it hit its lowest point again ($2.14)
A note that I took here is that the blow-off tops that I studied on Bitcoin’s price movement usually hit their “low” within a few months of the initial blow off top. But the journey back to that ATH took well over a year and the price trended well-below it for the majority of the time before the next blow-off top.
Interestingly enough, the DJI (Dow Jones; American Stock Market) was shitting the bed around the same time too:

I’ve always felt like Bitcoin’s price movements and the stock market were very intuitively linked to one another.
Of course, Bitcoin was hit exponentially harder than stocks were. But it’s worth noting the similarities in the markets at the time. It’s not like Bitcoin fell off while the Dow Jones was crushing new ATHs every week.
Low Point During the 2011 Bitcoin Bear Market

It finishes the year strong around $9 in 2011. I can finally use TradingView because they actually have this data on the Bitstamp charts.
2011 is the first of many years that establish the trend (and this is also the case w most global markets) of wild speculation and investment during the fall months (particularly as we get closer and closer to Christmas/New Years’ Eve)

Of course, following this gain throughout November and December, there’s another big blow out in the price during the first few months of the year
Price stabilizes around $5 for a while. Doesn’t ever touch that $2-$3 range though again. Bitcoin buyers are done with that.
The end of the year for 2012 finishes with a bang for Bitcoin though. It outperforms the hell out of traditional markets as well (I feel like people thinking the world would end in 2012 had something to do with this).
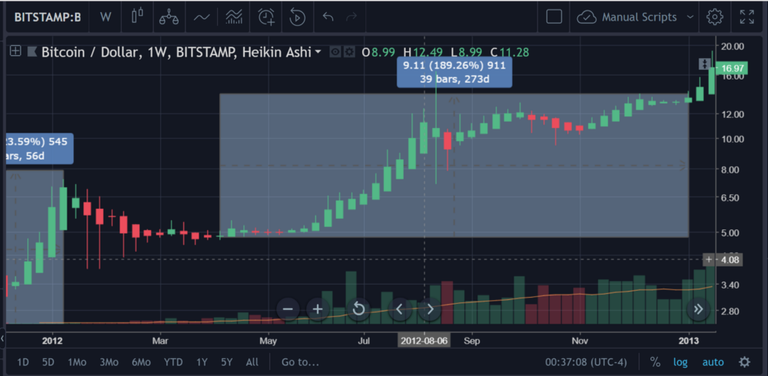
Appreciated 189% from April 2012 to January 2013. Ended up at $17 roughly.
Bitcoin is still well short of its ATH at that point.
The ATH was $29 which occurred June 2011.
The ATH of $29 set June 2011 was not surpassed until February 24th, 2013 btw. So that’s 20, almost 21 months from that blow off top in 2011 to the new ATH.
A year and 8/9 ish months.
Just an FYI
Analyzing the 2013 Bitcoin Bull Market
2013 is an interesting year in my opinion because of course the Mt. Gox event happened and we all sort of accept that that’s the reason or the trigger for the massive price drop in Bitcoin. But, 2013 is when you can really notice how closely the stock market and Bitcoin are paired together

Here’s the price action for Bitcoin from January 2013 to December 2013.

Here’s the DJI over the same period.
Both had amazing years. I’ll put the DJI to the side though, because the most relevant and intriguing stuff happens during the following years.
What I noticed about Bitcoin’s price action, in specific, up to that peak in 2013 (and afterward too), is that a price consolidation before the continuation of a bull run typically has only taken 6–8 months max.

You can see here that Bitcoin hit a localized top in 2013, followed by a period of consolidation (I boxed) before continuing the bull run
Some folks are under the impression that this is what could be happening to the price now.
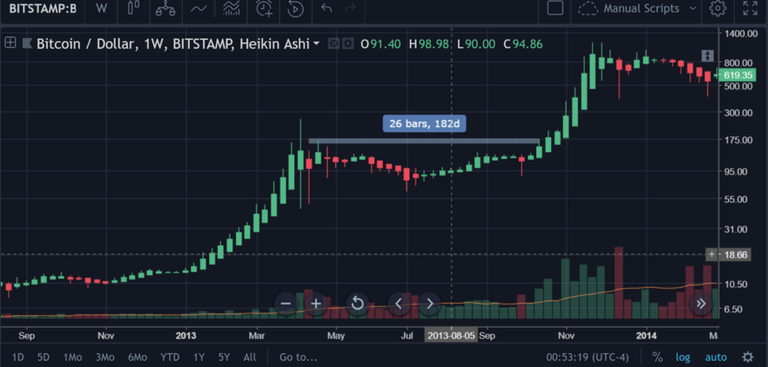
Price took 6 months in 2013; from April to October, before continuing on and finishing the year strong.
2014, obviously was an ugly year from that blow-off top at roughly $1100.
Now, in this part, we’re going to analyze the bear markets that followed the 2011 and 2013 bull runs.
Bitcoin Bear Market Analysis for 2013

$400 stood as a reliable support for the price throughout 2014 for 9 months before it finally caved in September

That support was noticeably 64% lower than the ATH

Once the price broke down south of that support, it led to a cascase of sell volume that brought the price to its ultimate low; $155 (approx.)
That was 60% below the $400 support roughly.
Worth noting that the price did not break over this support for over a year (420 days)

Utlimately, this led to an 86% (approx.) drawdown overall from ATH to the lowest point of that bear market
What’s crazy is how similar this situation is to the breakdown in the price in 2011 as well (elapsed over a slightly diff time frame though)
Bitcoin Bear Market Analysis for 2011


$7.80 — $8.50 range was holding as support in the months following that blow off top at $29.
That was approx. 70% below the ATH. Then the price broke below that support in September and hit the all-time low of $2.50 (approx.) the next month in October.
In 2014, that support broke in December and the all time low for that period of $155 was hit the next month in January.
Both supports had held each other for months. And when those supports finally broke, they became resistance points. And it took the price almost a year in each scenario before breaking that resistance.

From that break below $8 in September 2011, the price did not surpass that point again until July 2012.

Similarly, after the price broke below support in January 2015, it did not break back above December 2015 (11 months later)
So a little under a year, misspoke by saying it took a year.
Analyzing the Results of Our Observations
It’s worth noting though that in both cases (2011 and 2014), after the major support was broken, the all time low for those periods hit and then the price eventually cracked above that resistance once again — the price never again fell below that point.
So, let’s recap 2011:
Bitcoin goes through mania in 2011. Appreciates from just pennies on the dollar up to $29.58.
The vast majority of the price gain comes in the 1–2 months before the ATH.
There’s a tremendous blow-off and the price draws down 70%.
This 70% point serves as the long-term support for a few months. This stood at $7.80-$8.30 (range estimate).
Eventually the support broke in September 2011. Price falls all the way down to $2.40 ish. This is a total retrace of 90%+ which is steep.
The price stays below the long-term support of $7.80-$8.50 for the next 8-ish or so months.
Once the price does break through the long-term support (which became resistance since the price was beneath it), Bitcoin never saw south of $8 again.
Price continued to appreciate until the next ATH in December 2013.
So, let’s recap 2013:
Bitcoin goes through mania in 2013. Appreciates from just $15 all the way to $1100 (approx)
The vast majority of the price gain comes in the 1–2 months before the ATH.
There’s a tremendous blow-off and the price draws down 65%.
This 65% point serves as the long-term support for a few months. This stood at the $380-$450 range.
Eventually the support broke in December 2014. Price falls all the way down to $150-ish. This is a total retrace of 85%, which is steep.
The price stays below the long term support of $400 for the next 10–11 ish months (until December 2015).
Once the price does break through the long-term support (which became resistance since the price was beneath it), Bitcoin never saw south of $400 again.
Price continued to appreciate until the next ATH in December 2017.
You see where we’re going with this right ?
So, let’s recap 2017:
Bitcoin goes through mania in 2017. Appreciates from just $800 all the way to almost $20k.
The vast majority of the price gain comes in the 1–2 months before the ATH.
There’s a tremendous blow-off and the price draws down 65% (seriously; $6.8k is actually 65% below)

- This 65% point has served as the long-term support for a few months.
When do we think #5 is going to come into play? And if we don’t think #5 is coming into play, why not? It appears as though the price has already broken this point technically, but it has not fallen out of our Bull Defense Zone (different article; ask me to outline if you need it).
Conclusion/Takeaways
You could take this negatively like “Shit, this dude could be right. The price might drop way more from where we’re at.”
Or you could do the math and see where the low was after the 2011 and 2013 bull runs and calculate how much money you would’ve made if you caught either one of them.
And then realize that this might potentially be an opportunity to be in prime position to get another cash grab like that.
Lowest point after the 2011 bull run was $2.50. Roughly. Next ATH was $1100.
Next lowest point after the 2013 bull run was $150. Roughly. Next ATH was $20k.