Bitcoin Chart Analysis January 20, 2018
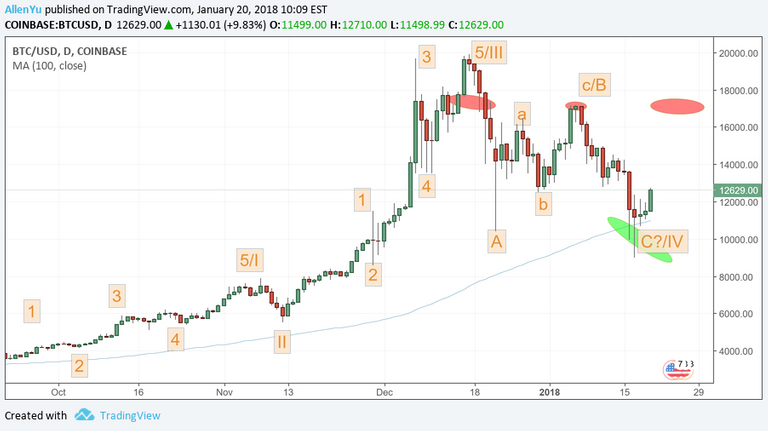
We have initial indications that the bottom is in- as long as the 100 day simple moving average (trending blue line @10,500 ) holds - pressure remains up.
In terms of wave patterns - we have what appears to be a completed C-wave of IV down - either setting up for a 5th wave up or another series of 1-2's.

This is an @OriginalWorks by @CryptoSurfer - Follow, Upvote, Resteem, Participate!