From an Elliot wave perspective, we are currently in the wave 5 of wave C on Bitcoin (graph 30 min).
As you can see, we made a leading first wave diagonal in wave 1 of wave C


A very good short entry point was at $7500 which was at the confluence of:
- The trendline which starts at $11600 and goes through the high of wave 2, and now wave 4 as well
- The 0.382 Fibonacci retracement of wave 3 of wave C
- The 1.618 fibonacci extension of AB of wave 4
- The 0.887 fibonacci extension of wave 12 of wave C of wave 4
- Counting the 5 waves in the wave C of wave 4 helped us as well to come up with this target
- This entry point was forecasted in this video:

A second good entry point was at the break of the neckline of the head and shoulder pattern formed by the top of wave 4 and the beginning of wave 5:

We are now in the process of making wave 4 of wave 5 (or wave B of wave 5 if you label your waves accordingly to the Elliot wave rule for the C wave diagonal)

The target for wave 5 will be somewhere on the trendline, possibly at the confluence of the trendline formed by the low end of the wedge (or C wave diagonal) and the horizontal resistance formed by the previous low at $6000. To target the bottom, make sure to count 5 waves in the wave 5 (or wave C depending on how you label it) of wave 5 of wave C.

For the bullish falling wedge or C wave diagonal we are currently in, you should not draw it like this:

This is wrong from an Elliot wave perspective:
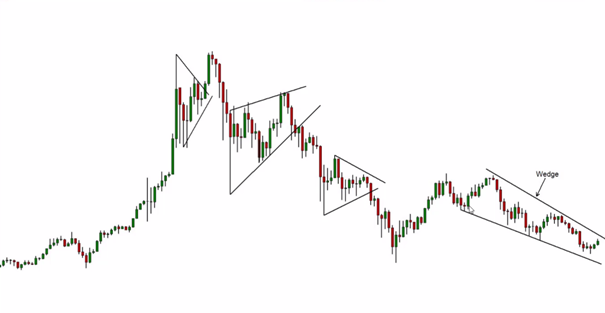
As stated previously, from an Elliot wave perspective the wedge should start at the low end of wave 1
If you draw your wedge like this, you break the Elliot waves rules because in Elliot waves theory, wedges or diagonal can only be found in waves 1-5 and C, and never in waves 2-3-4-A-B.
So if you draw it like this, you are saying that we have a diagonal in wave 2 and another diagonal in wave 3, which again, is theoretically wrong.
If you draw it like this, this would also mean that we have already completed 5 waves in wave C, which I really don’t think is the case.

Now, you should consider the fact that very often in wave 5 of a diagonal, we end up having a throw over, meaning that wave 5 breaches the trendline formed by the wedge, before bouncing. It doesn’t happen everytime, but this is definitely something to have in mind.

Will this double bottom at $6K be the end of the bear market?
Well, after this bounce, the entire ABC structure of Elliot waves will be completed:
A double bottom is also a very powerful pattern, as well as a C wave diagonal. Both these patterns are combined in our current configuration.
At the $12K level, we made a double top, after this we dropped by %50
We made another double top at $9K, and we dropped 25-30% after this.

The probability for us to bounce off of the $6K level is extremely high. However, is this going to be the end of the bear market?
Keep in mind a few things:
First, historically, during bear markets, Bitcoin has always corrected more than 70% (if the $6K level is the low point of this bear market, this will be a 70% correction):


Second, we should mind the daily RSI:
- During the 2015 bear market after the $1150 pic, the daily RSI reached a low of 19


- During the 2013 bear market after the pic at $260, the daily RSI reached a low of 21


- During the 2011 bear market after the pic at $32, the RSI bottomed at 17


- During the current bear market, the daily RSI only reached a low of 25, which is far from the lows of the previous bear markets.

So how can we know if this is the bottom of this bear market? - During the 2015 bear market, after the bottom, we made a 100% jump in price, before a 0.618 Fibonacci retracement


- During the 2013 bear market, after the bottom, we did exactly the same thing, a 100% jump in price before a 0.618 Fibonacci retracement

- During the 2011 bear market, after the bottom, we made a 280% jump (after a correction of 94%) before making a 0.618 Fibonacci retracement.

So we want to see something like this this time again
So this is a bit early to speak about this, but:
If from $6K we make a 100% jump, this will get us to $12K, which is a big resistance level with a previous double top. We could make a triple top at this level, correct to the 0.618 Fibonacci level, before bouncing upwards again. The bear will only be officially over once we breach this $12K level

You can follow me here:
Follow me here:
https://steemit.com/@cryptoteddybear
https://twitter.com/cryptoteddyb
https://medium.com/@skynoxx/
https://www.youtube.com/channel/UC7hFTrYGRevY1h415GkPLSg/featured?view_as=subscriber
DISCLAIMER: I am not a financial advisor. This is not financial/investment advice.
Thank you for reading this technical analysis on bitcoin, if this helped you, please consider donating to this bitcoin address:
359C9Ak36MvoRzpN7whhrZ17khXyLYJuf4

Congratulations @cryptoteddybear! You have completed some achievement on Steemit and have been rewarded with new badge(s) :
Click on any badge to view your own Board of Honor on SteemitBoard.
For more information about SteemitBoard, click here
If you no longer want to receive notifications, reply to this comment with the word
STOPDo not miss the last announcement from @steemitboard!