Bitcoin: Price Action/Trend Update
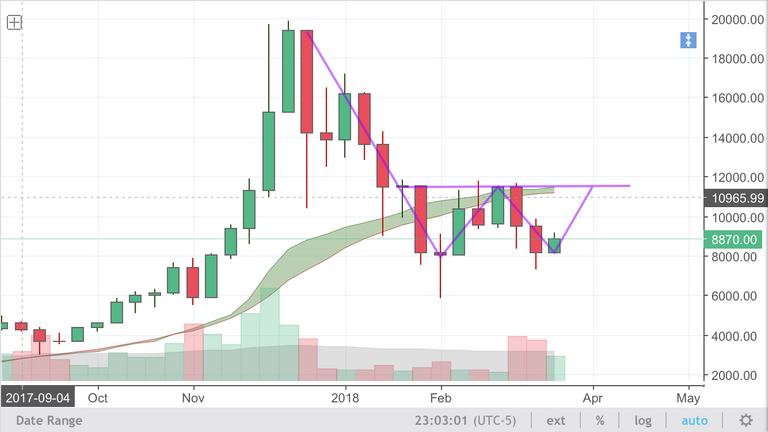
It’s time to be bullish again. First, let’s look at the weekly chart. We are forming an absolutely beautiful double bottom. We will need to open above $11.4k on the weekly to truly be out our current shit zone. As you can see, we haven’t opened a weekly candle above $9.5k or so since the end of January.
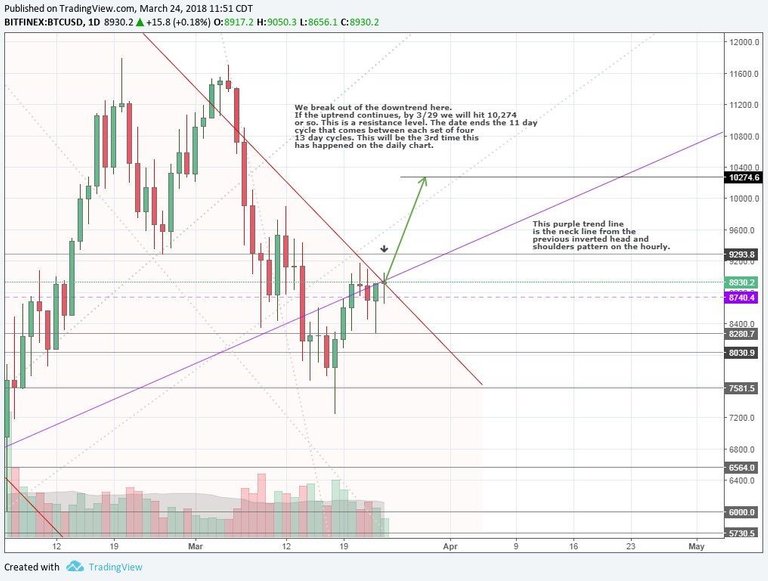
Secondly, the daily chart shows that we are either about to break above a precious inverted head and shoulders neckline and out of the larger downtrend, or we will simply follow this neckline out of the downtrend. The date mentioned on the chart is based off of the 13day cycles I’ve discussed before which you can find here and here
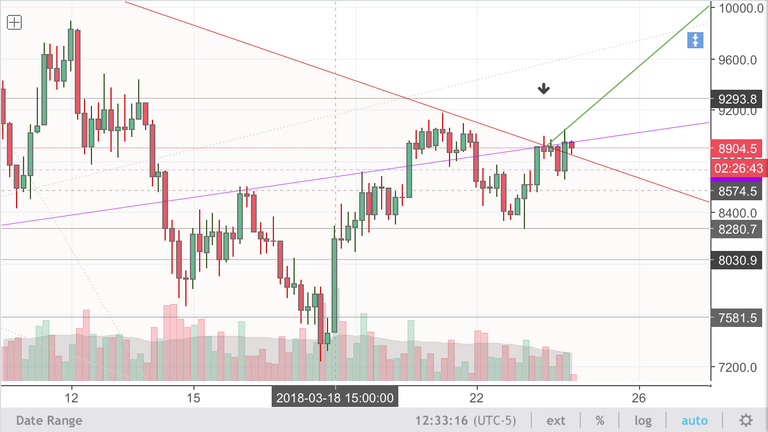
Lastly, a look at the 4h chart for a better view of the this neckline’s importance. This inverted head and shoulders pattern was what reversed the most recent fall from $11.7k. If we break above it, it becomes support speeding up the upwards trend. If it continues to be resistance, we grow slower but still upwards. As you can see, this neckline has continued to be resistance for the most recent candles and we have yet to close above it.
This of course is not financial advice. If you enjoy my content, please leave me an upvote and comment.
FACEBOOK: https://www.facebook.com/CTOMMod/
GROUP: https://www.facebook.com/groups/CTOM1
TELEGRAM: @theferaltaint
TWITTER: @TheFeralTaint
good post.......!
follow me and visit my blog.....!
Do you have an upside (or downside) price target?
Just saw this. At the time, I was short. I went long near the bottom