For education purposes only.
Price (Sideways)
Following on from yesterday's price review (here), the BTC price has broken the second descending resistive trendline (thin, red), which began about a month ago.
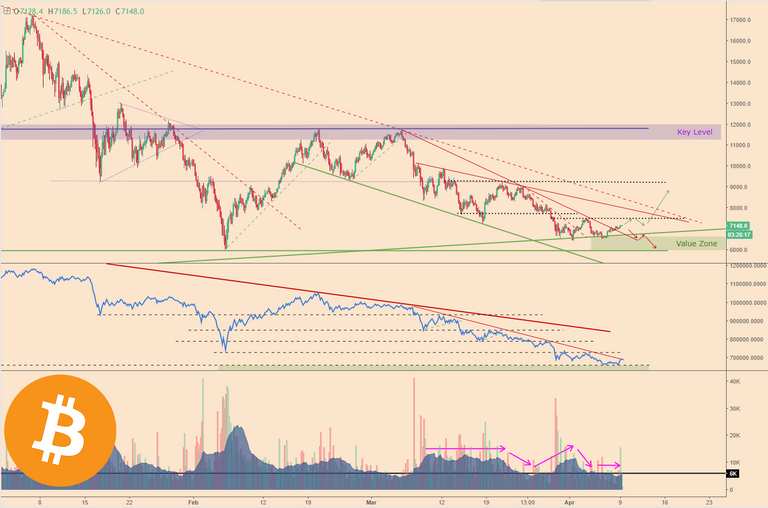
This suggests a rounding out of the price action, but there is still clearly a risk of further downside as the price is still firmly within a downtrend.
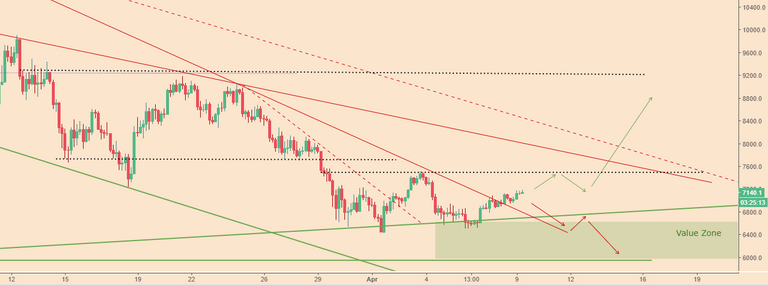
The price made what could be viewed as a double bottom pattern at about the $6,500 level. At the very least it made the recent lower-low, lower-high price action less convincing.
For me to be convinced that this is a genuine reversal, I'm looking for the price to make a higher high (above $7,500) and then a higher-low (above $6,500) and then I'd be looking for a long entry.
Volume (Steady)
The average trading volume is holding steady (Bitfinex), with a recent small spike today.
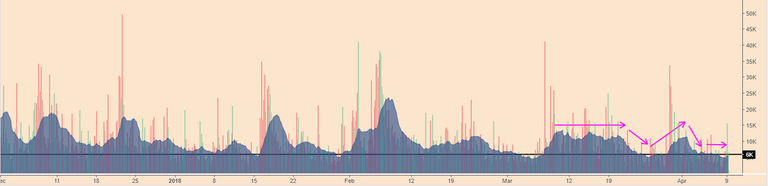
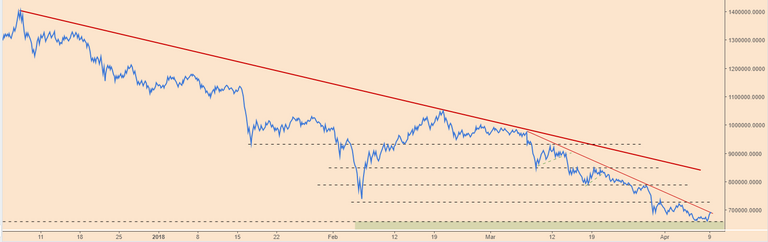
This indicates some buying activity at the $7,000 level, which is supported by the On-Balance-Volume (OBV) indicator which has had a spike (suggesting increased accumulation) and is now testing the descending trendline resistance (thin, red).
Bias (Neutral, looking for long setup)
BTC is certainly not out of the woods yet, this bear market could easily take us to sub-$6000 levels, however, the price action over the past few days has indicated some buyer strength and a change in the price behaviour.
Let's keep our eyes peeled for reversal confirmation, being vigilant of bull traps and false breakouts.
Until tomorrow,
Bobby
(Trader).