For education purposes only.
Price (sideways, squeeze)
Following on from yesterday's price review (here), the BTC price has continued narrowing in a horizontal triangle pattern.
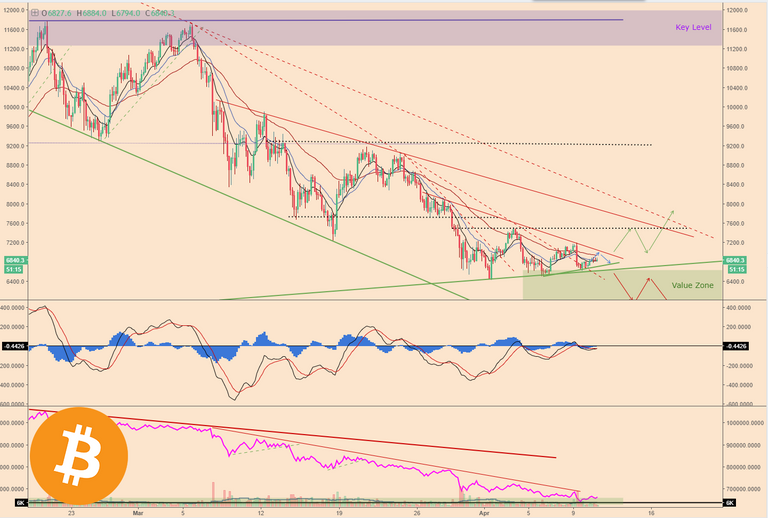
Using the moving averages as a visual guide, the price is still in a downtrend, and this consolidation area may simply be a pause and continuation pattern if it breaks to the downside.
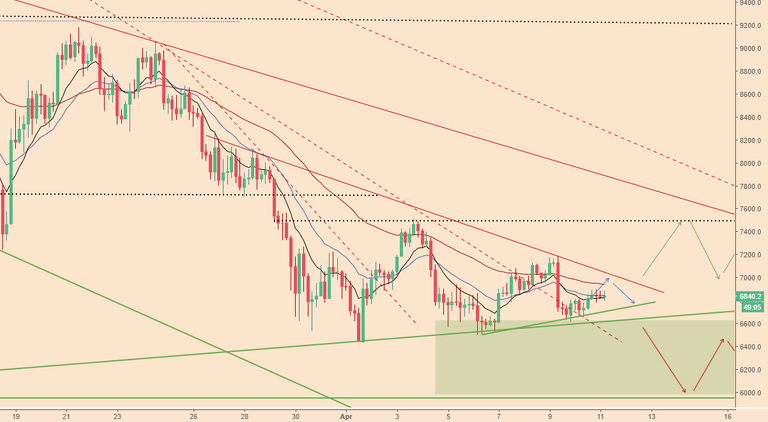
However BTC has not convincingly broken into the sub-$6,500 levels so this may represent a significant area of support (value) where buyers are willing to step in.
If so, the current sideways consolidation, could be a rounding out of the price action stemming the recent downtrend.
A break of this triangle pattern to the upside and a test of the $7,500 would reinforcing this view and may present long trade opportunities, if it realises.
Volume
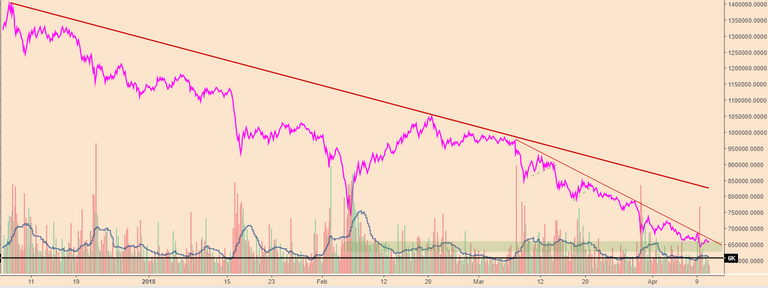
The average trading volume (bitfinex) is holding steady at 6k (4hr), but the On-balance-Volume indicator has still not broken the stubborn descending trendline (thin, red), which indicates sellers are dominant and the trend hasn't yet changed.
Strategy (long, reversal)
Before considering a long trade, the price needs to break and resolve this triangle consolidation. If it is to the upside, I'm looking for a test of $7,500 and then a pull-back to make a short term higher-high and higher-low, where I'll consider a long trade.
Until tomorrow,
Bobby
(Trader)