For education.
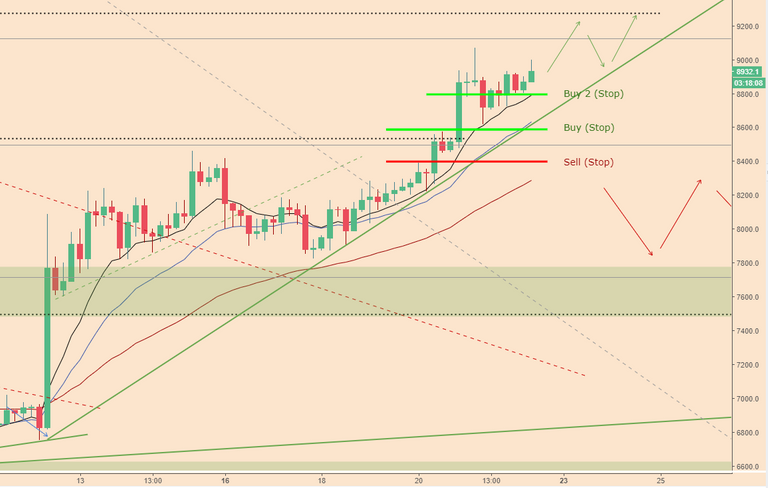
Price (trending up)
Following on from yesterday's review (here) and trade signal (here), BTC has continued to trend higher.
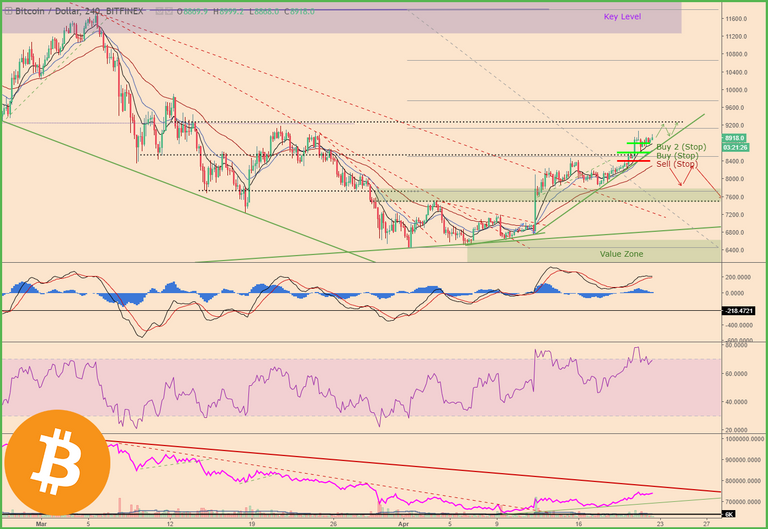
Both long trades (@ $8,600 and $8,800) are in profit and if you're in these or similar traders, you might consider moving your protective stop to breakeven (particularly for the first trade), but this is not financial advice.
Indicator Check (possible divergence)
We want to be out of these trades before a major reversal / pullback. Using divergence on the MACD and RSI as an exit signal, can be useful.
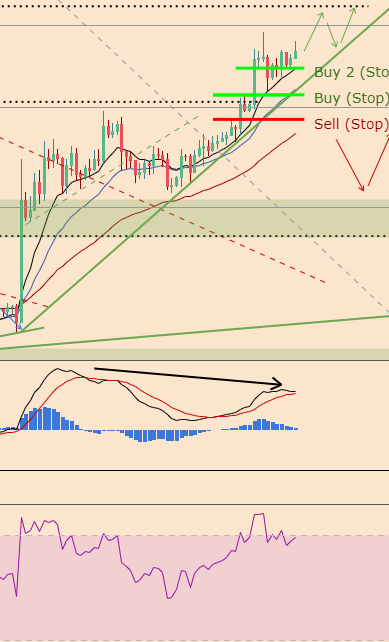
As it currently stands, there is no evident divergence, but if the MACD crosses back down, that might show a divergence, so it's worth keeping an eye on.
Volume (buying strength)
There was a decent surge of trading volume alongside the price breakout which was clearly buyer dominated.
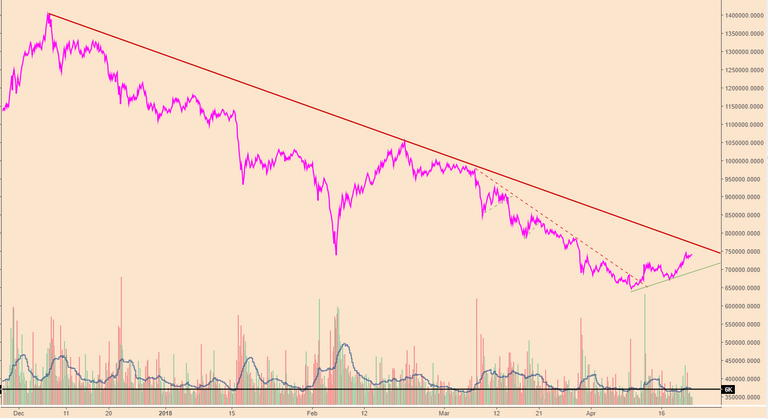
The On-Balance-Volume (OBV) pink line is still marching higher which shows continued buying strength, however, the OBV is approaching the long-term downtrend line, which may presage a return of sellers.
Trading strategy (managing open long trades)
The current trades have the following targets:
Target 1: $9,300
Target 2: $9,500
Target 3: $9,900
Target 4: $11,000
Which target we exit these trades at will depend on the specific price action, but I'll provide any updates that changes this.
A breakdown below the current rising trendline or siginificant indicator divergence would also signal an exit.
Until tomorrow,
Bobby
(Trader)