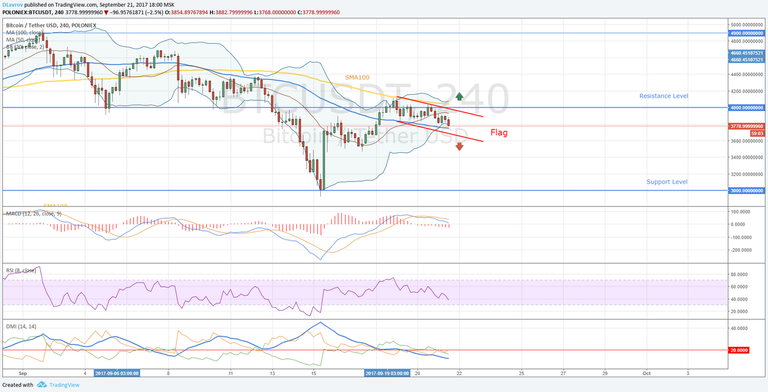
The market reached 4000.00 resistance level and SMA100. This zone is very important because if the price can move above this resistance zone, we'll have good confirmation of further upward movement. We can spot a flag pattern which belongs to a group of trend continuation chart patterns. We can expect that the price breaks the resistance line of the flag and move to 4500.00 level. But at the same time we must be ready to see downward movement. MACD shows that the market can move lower in short term. If the price drops below the support line of the flag, it will be confirmation of downward movement to 3000.00 support level. If the market drop to this zone, it will be good opportunity to add more volume to long positions. In long term Bitcoin is bullish market.
Get more trading ideas here https://www.tradingview.com/u/DLavrov/
Follback
What do you make of the bear break from consolidation? I was predicting it. We consolidated and were trading sideways for 2 days as we approached the down trend resistance line. Looks like we're still in a down trend after being over bought and over hyped for so long.