If Bitcoin History Repeats Itself
- Part 1: Descending Triangle Looking Similar To 2018
- Part 2: Measuring The Move of the Descending Triangle Breakdown
- Part 3: A repeat of 2014? Worst Case Scenario A $2,500 Low
- Part 4: If Bitcoin Repeats History? Extrapolating 2012 Breakdown
- Part 5: If 2017 Descending Triangle Repeats? Best Case Scenario
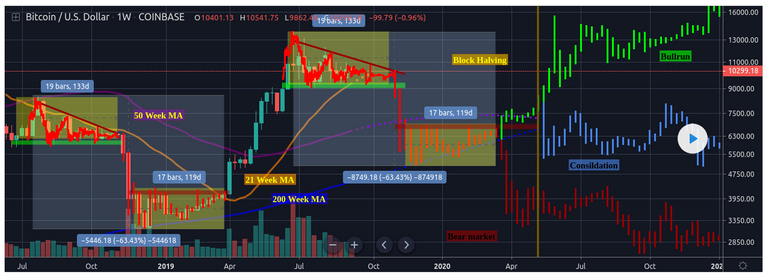
The daily bars of the 2018 descending triangle are starting to match the current 2019 descending triangle . If the bearish breakdown also repeats itself in the same way, then this would be the outcome, continuing on from where the charts fit together. Notice how a similar bearish breakdown would take us to the 200 Week MA, given its current trajectory. This would be long-term bullish if this happened, ie finding support again one year later $2K higher. I'd therefore find it unlikely to return to a bear market, or even continued consolidation (which would both be under the 200 Week MA).
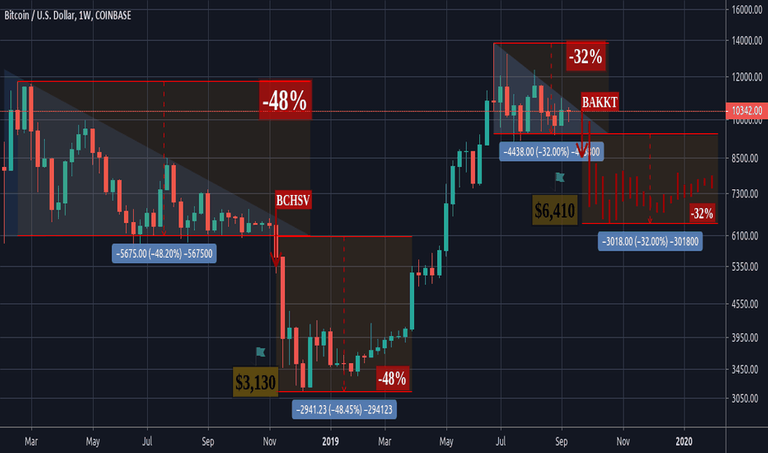
In 2018 there was an accuracy within 0.25% ($16) of the measured breakdown of the descending triangle . The calculation equaled $3,145 (-48.2%) with the low arriving at $3,129. Based on the 2019 Weekly descending triangle, the measured move of -32% takes the price to $6,410, give or take $16. If this Weekly triangle is breached to the upside I will calculate the Daily descending triangle, that has a reduced measured move.
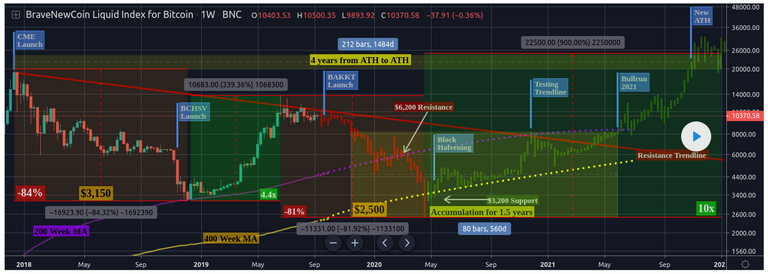
This worst case scenario extrapolates the second half of the 2014 bear market going into 2020 with ATL at $2,500 and new ATH in November 2021, as well as reaching $30,000 within the same year. This assumes a double bottom will form in April 2020 prior to the halving, followed by 1.5 years of accumulation/consolidation, with a new ATH being made 4 years after the 2017 ATH.
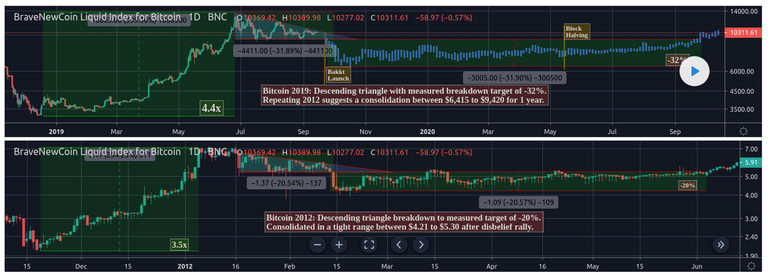
Bitcoin 2012: Descending triangle breakdown to measured target of -20%. Price consolidated in a tight range between $4.21 to $5.30 after disbelief rally. 7 years later, Bitcoin 2019: Descending triangle with measured breakdown target of -32%. Repeating 2012 suggests a consolidation between $6,415 to $9,420 for 1 year.
The time frames are very different, however the emphasis here is on a BTCUSD descending triangle at the top of a disbelief rally from the bottom of the bear market after a 250% (3.5x) rise. The measured move back then was -20% that Bitcoin achieved. The -32% breakdown target after a 340% (4.4x) doesn't seem unreasonable.
Credit to KaliCrypto for the inspiration.
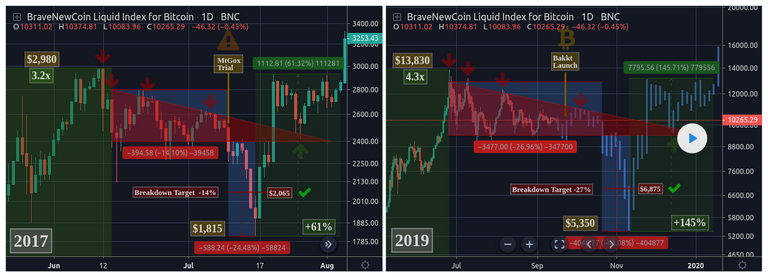
I remind you of July 2017 descending triangle that completely overshot the measured target by around 12%. This is for all the traders who claim descending triangles never break to the downside in bull markets at the top of the trend. Bare in mind this was at the top of a full-blown bull market, after reaching a new ATH and 3.2x from April 2017 low. This was otherwise half way through the 2017 bull market from a 2016 low of $150, so roughly 20x. This is yet another example in the repeating Bitcoin history series to show how they do break to the downside, especially after parabolic bull markets.
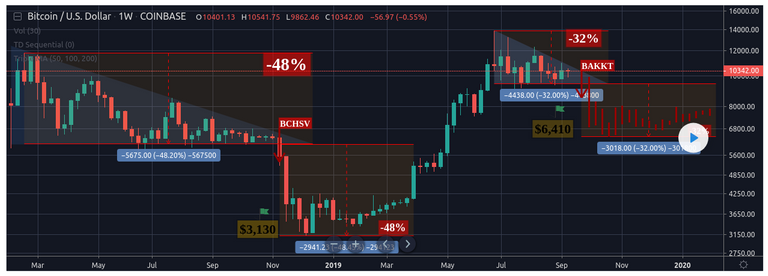
The extrapolated breakdown comes to a low of $5,350 (-43%) with a measured target on the Daily descending triangle of $6,875 (-27%). Note this is different to the Weekly descending triangle measured target of $6,410 (-32% see here), and is therefore dependent on BTC breaking out of the Weekly descending triangle to the upside, while remaining within the Daily triangle, which isn't a lot to ask for.
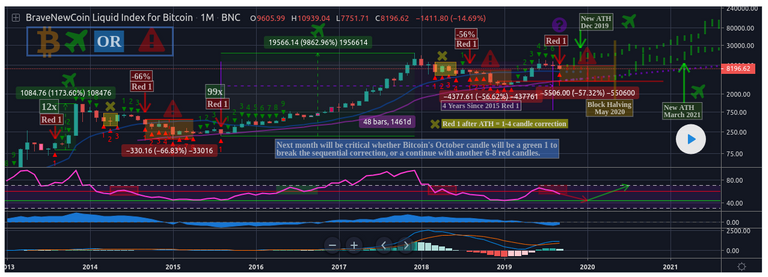
With the month of September coming to close in the coming days on a Monthly TD Sequential Red 1 price flip, October will be critical as to whether Bitcoin's monthly candle will close as a green 1 to break the sequential correction, or continue with another 6-8 red candles - as has happened in 2014 and 2018 during bear markets. Note that the Monthly Red 1 candles immediately preceding ATH have been excluded, as previously only have led to a 1-4 candle correction.
As intriguing is that 4 years have now passed since Bitcoin's 2014 Monthly Red 1 candle that led to the 2016-2017 bull market. Additionally, the monthly RSI has broken down from 60 ( bullish ) to neutral territory, indicating scope for a 7-9 candle correction.
If Bitcoin Repeats History?
- 2012: Breakdown to $6,415 with 1 year consolidation (Part 4)
- 2014: Breakdown to $2,500 with 1.5 years consolidation (Part 3)
- 2017: Breakdown to $5,350 with 2 months consolidation (Part 2)
- 2018: Breakdown to $5,050 with 6 months consolidation (Part 1)
- 2019: Measured move to $6,410 to $6,875 (Part 2 & 5)
That's a range between $2,500 and $6,875, with anywhere between 2-18 months of consolidation. Conclusion: Anything could happen. Look for clues.
Updated 19/09/19 with Part 5.
the support is good though
It broke too easy.